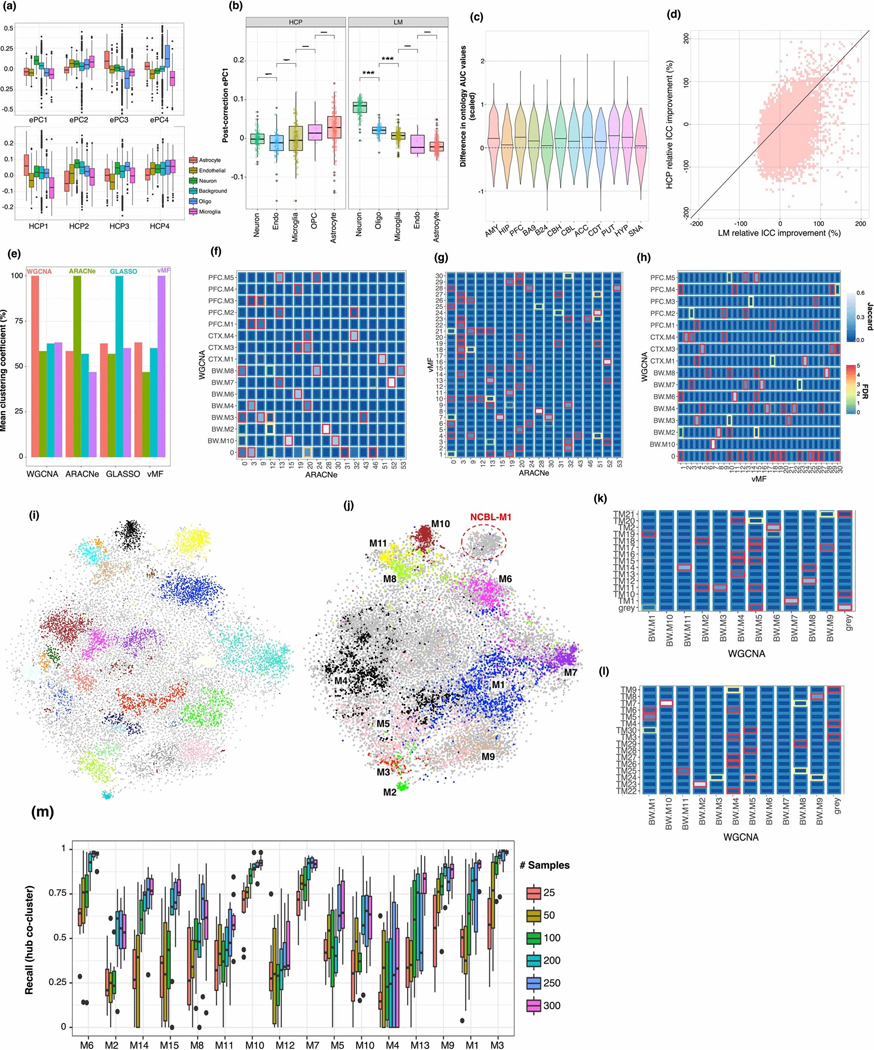
Extended Data Figure 1:

(a) Standard boxplot (box: quartiles, whiskers: 1.5xIQR) of expression PC and HCP loadings onto canonical cell type genes, showing significant heterogeneity of loadings across cell types, (Neuron), 79 (Astrocyte), 242 (Microglia), 103 (Oligodendrocyte), 176 (Endothelial). (b) Standard boxplot (box: quartiles, whiskers: 1.5xIQR) of ePC loadings after covariate correction using HCP and LM base correction, showing that cell type heterogeneity of the 1st component of expression is lost after HCP correction. Gene set sizes as in a; significance (two-sided T-test) ***: < 0.001. (c) Network-based GO prediction accuracy for each brain region. The same gene holdouts are used in 10-fold cross validation, generating 10 values for the AUC difference of each GO category, which are used to generate a Z-score for the expected AUC difference. (d) Relative improvement to the integrated correlation coefficient for BRNHYP genes, for linear model and HCP based corrections. (e) Pairwise co-clustering statistics for the 4 algorithms compared in figure 1. X-axis denotes which modules are taken as the reference set. (f-h) Pairwise module overlaps between 3 of the 4 algorithms compared in figure 1 (GLASSO yielded too many modules to visualize here). (i) t-SNE embedding of gene features from whole-brain tensor decomposition, colored by DBSCAN clusters. (j) As (i), but colored and annotated with whole-brain modules. (l,m) Overlap between whole-brain consensus and tensor-decomposition + DBSCAN modules. Color scheme as in (f-h). (n) Standard boxplot (box: quartiles, whiskers: 1.5xIQR, bootstrap re-samplings) of within-module recall values for hub-gene co-clustering, demonstrating that at 100 samples, the recall is above 50% for most modules.
