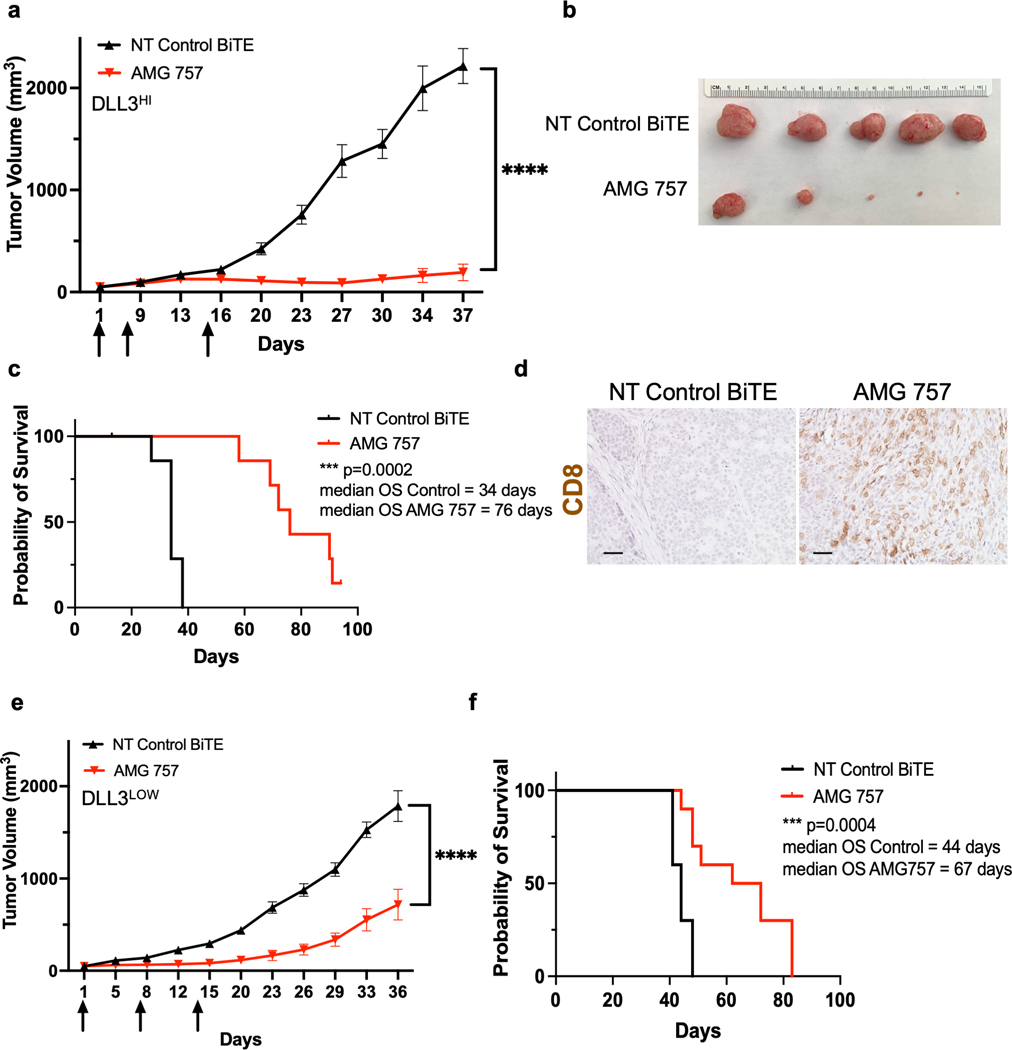
Figure 6. AMG 757 Antitumor Activity in DLLHI and DLL3LOW PDX Models.
a. Tumor growth curves in mice bearing LTL-545 PDX tumors (DLLHI) treated with AMG 757 (red) or NT Control BiTE® (black). Mice were administered human T cells on Day 0. Arrows indicate days of BiTE® treatment. b. Images of the endpoint tumors from mice in the study shown in (a). c. Kaplan-Meier survival curve of mice in the study shown in (a). Median OS is shown, n=15 mice per group. d. IHC images of CD8+ T cells in LTL-545 tumors taken 5 days after the first AMG 757 or NT control BiTE® treatment in (a). Scale bar, 50 μM. e. Tumor growth curves in mice bearing LTL-331R PDX tumors (DLL3LOW) treated with AMG 757 (red) or NT control BiTE® (black). f. Kaplan-Meier survival curve of mice from the study shown in (e). Median OS is shown, n = 10 mice per group. No mice were censored for panels c and f.

