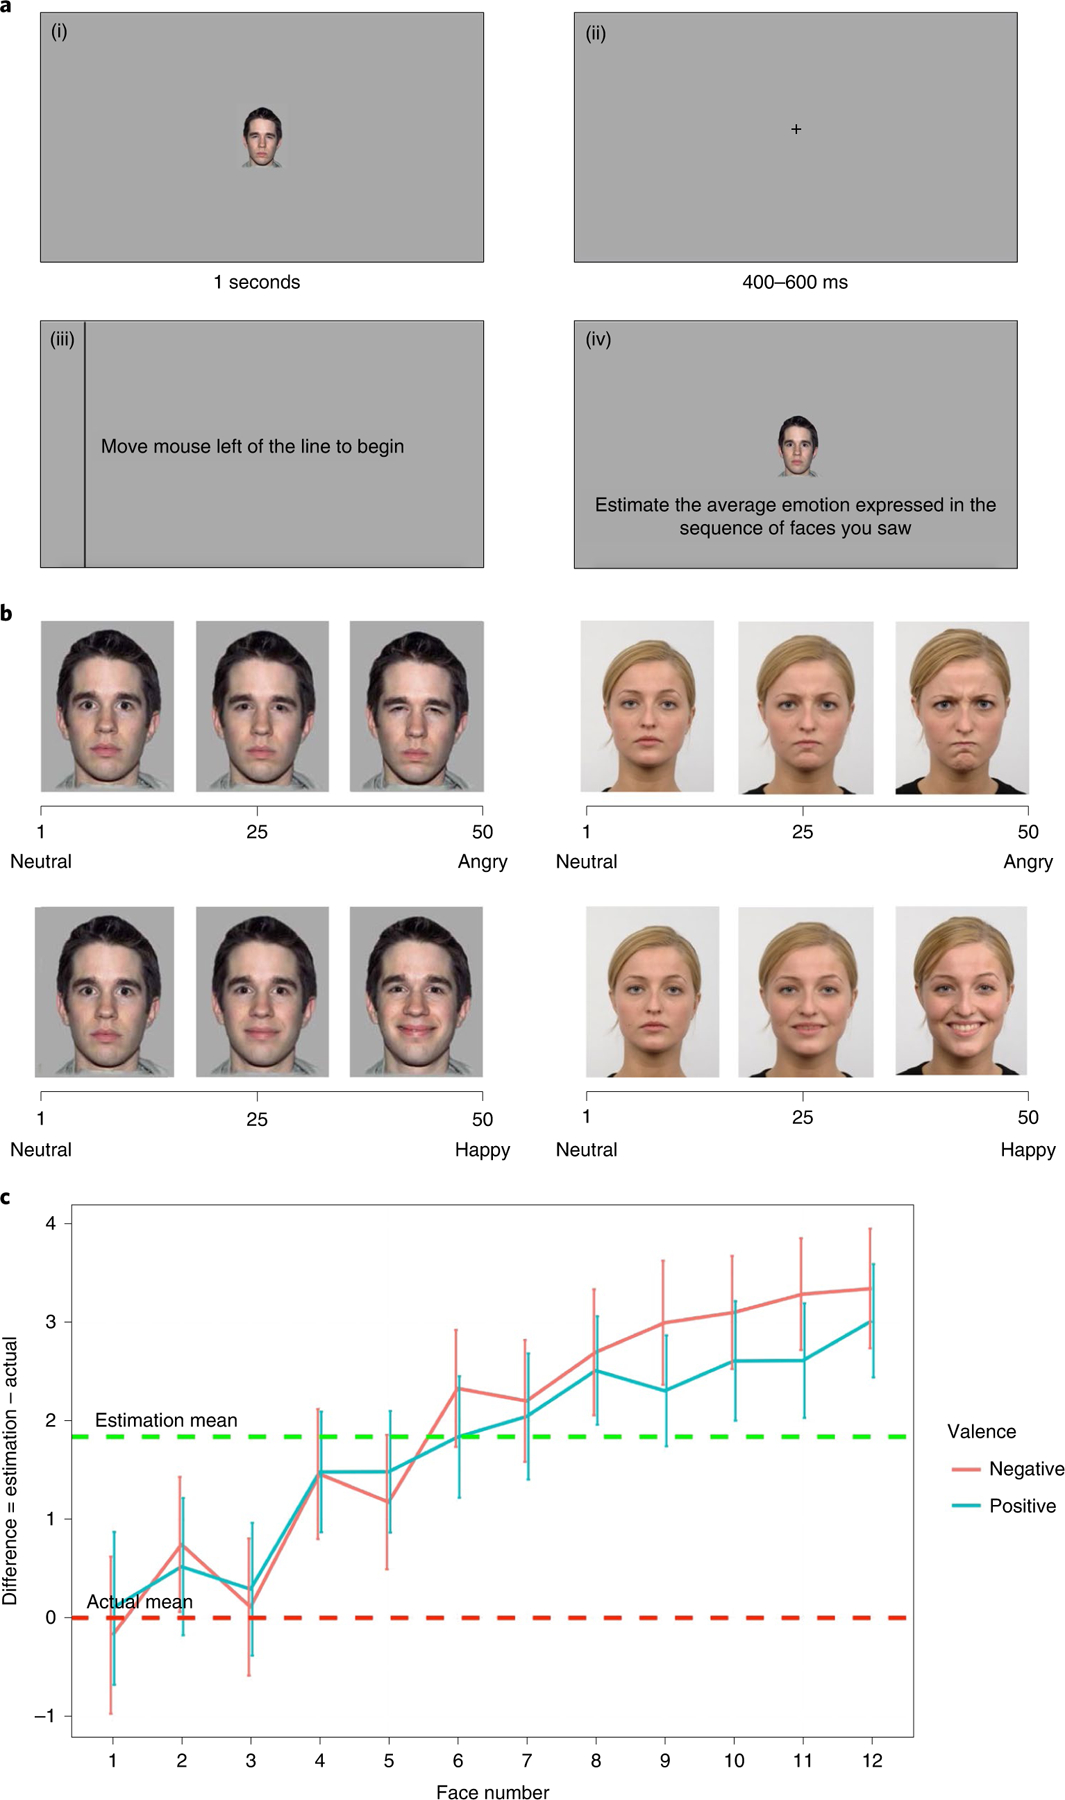
Fig. 1 |. Structure and results of Studies 1–4.

a, The structure of the amplification task used in Studies 1–4. The participants saw a sequence of 1–12 facial expressions, expressing different degrees of either anger or happiness, that appeared on the screen for one second ((i) represents one expression in the sequence). Between each expression, the participants saw a fixation cross for 400–600 ms (ii). The participants were then asked to move the mouse to the left of the line to begin the evaluation stage (iii). They were then asked to evaluate the average emotion expressed by these expressions by adjusting the intensity of a single morphed face (1–50, (iv)). b, Two samples (left, NimStim; right, Radboud) of three facial expressions from the neutral-to-angry scale (top) and from the neutral-to-happy scale (bottom) that were used in the studies. Values of 25 and 50 correspond to 50% and 100% intensities in our morph range, respectively. c, A summary of the results of the comparison between estimated and actual average ratings of the sequence in Studies 1–4 (). The analysis was done using mixed models (t-test). The x axis represents the number of facial expressions in the sequence. The y axis represents the difference between the participants’ estimation of the average sequence and the actual average. The data are presented as mean values confidence intervals. The green dotted line represents the average amplification across studies. The red dotted line represents the actual facial expression mean. Male and female images in b reproduced with permission from refs. 40,41, respectively.
