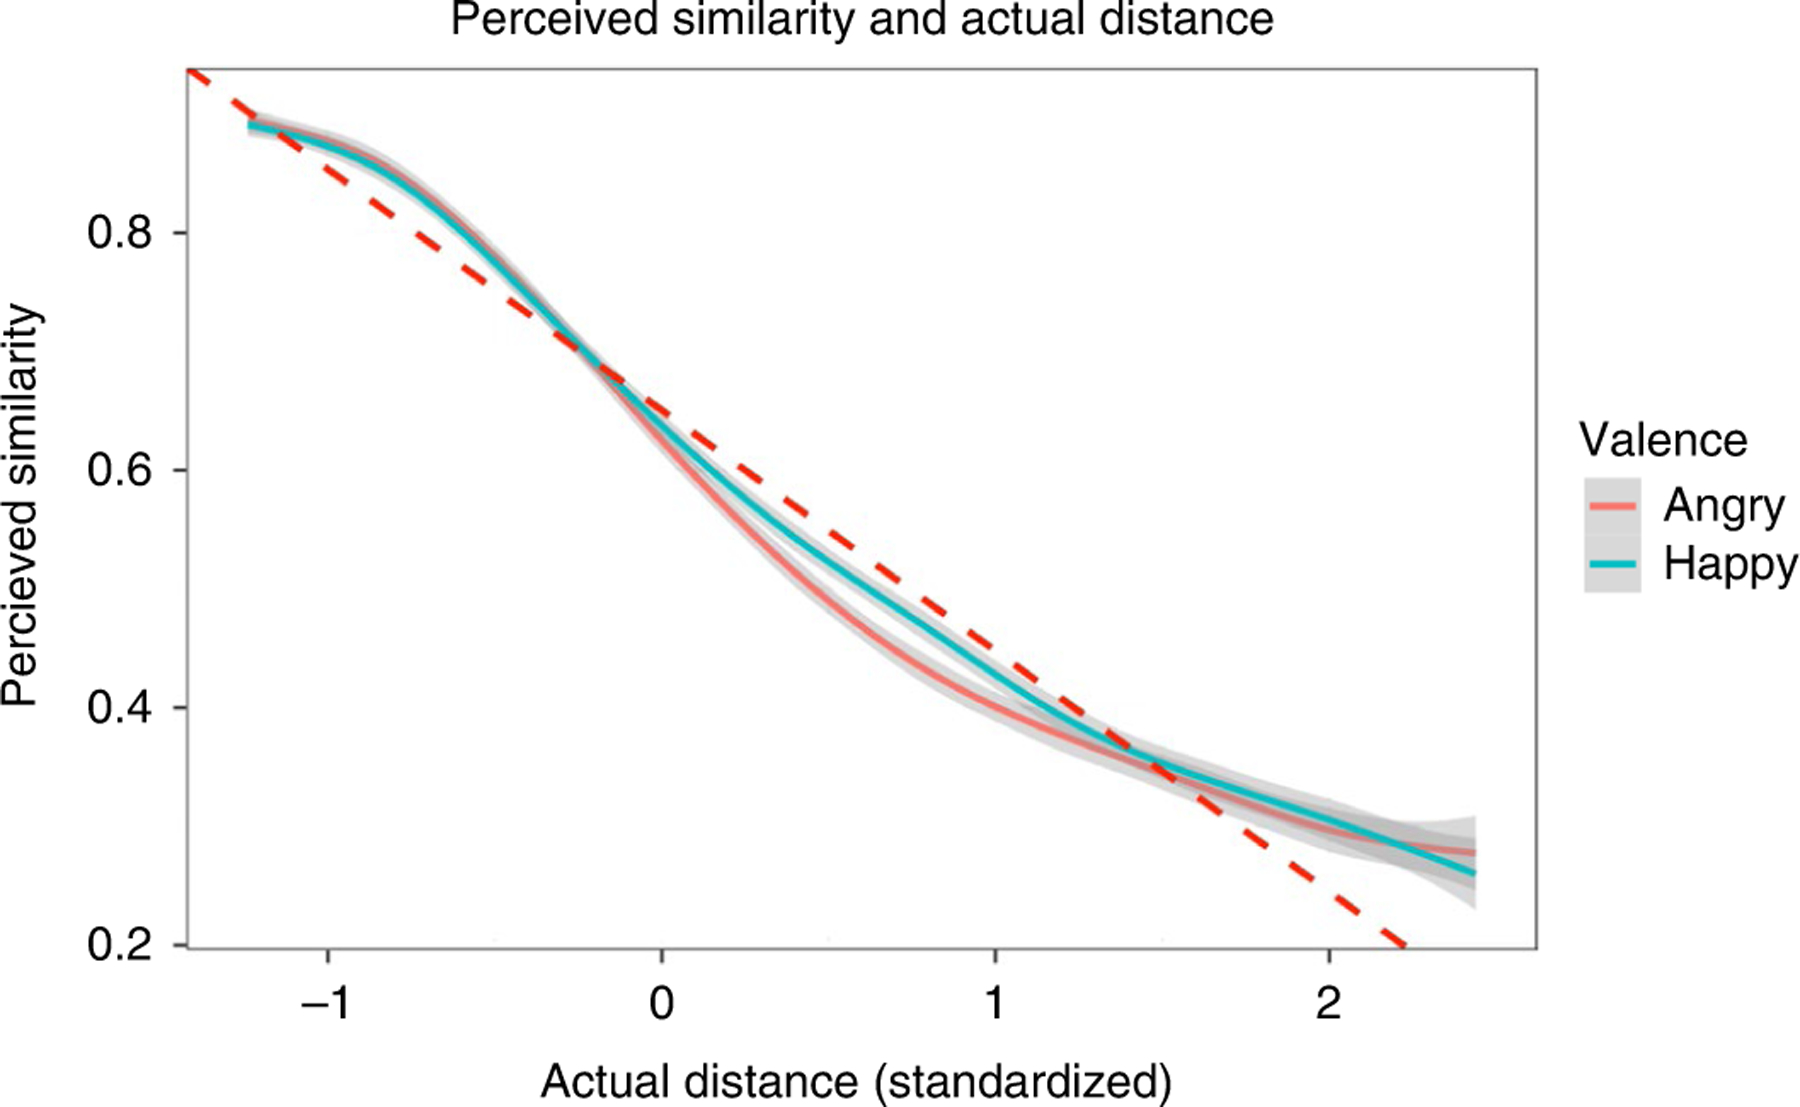
Fig. 2 |. Results from the similarity analysis in Study 8 (N = 100).

The x axis represents the difference between item 1 and item 2. The data are presented as mean values standard errors. The analysis was done using mixed models (t-test). As indicated by the changes in the degree of slope, both shorter distances and longer distances were perceived as more similar than distances between these two extremes.
