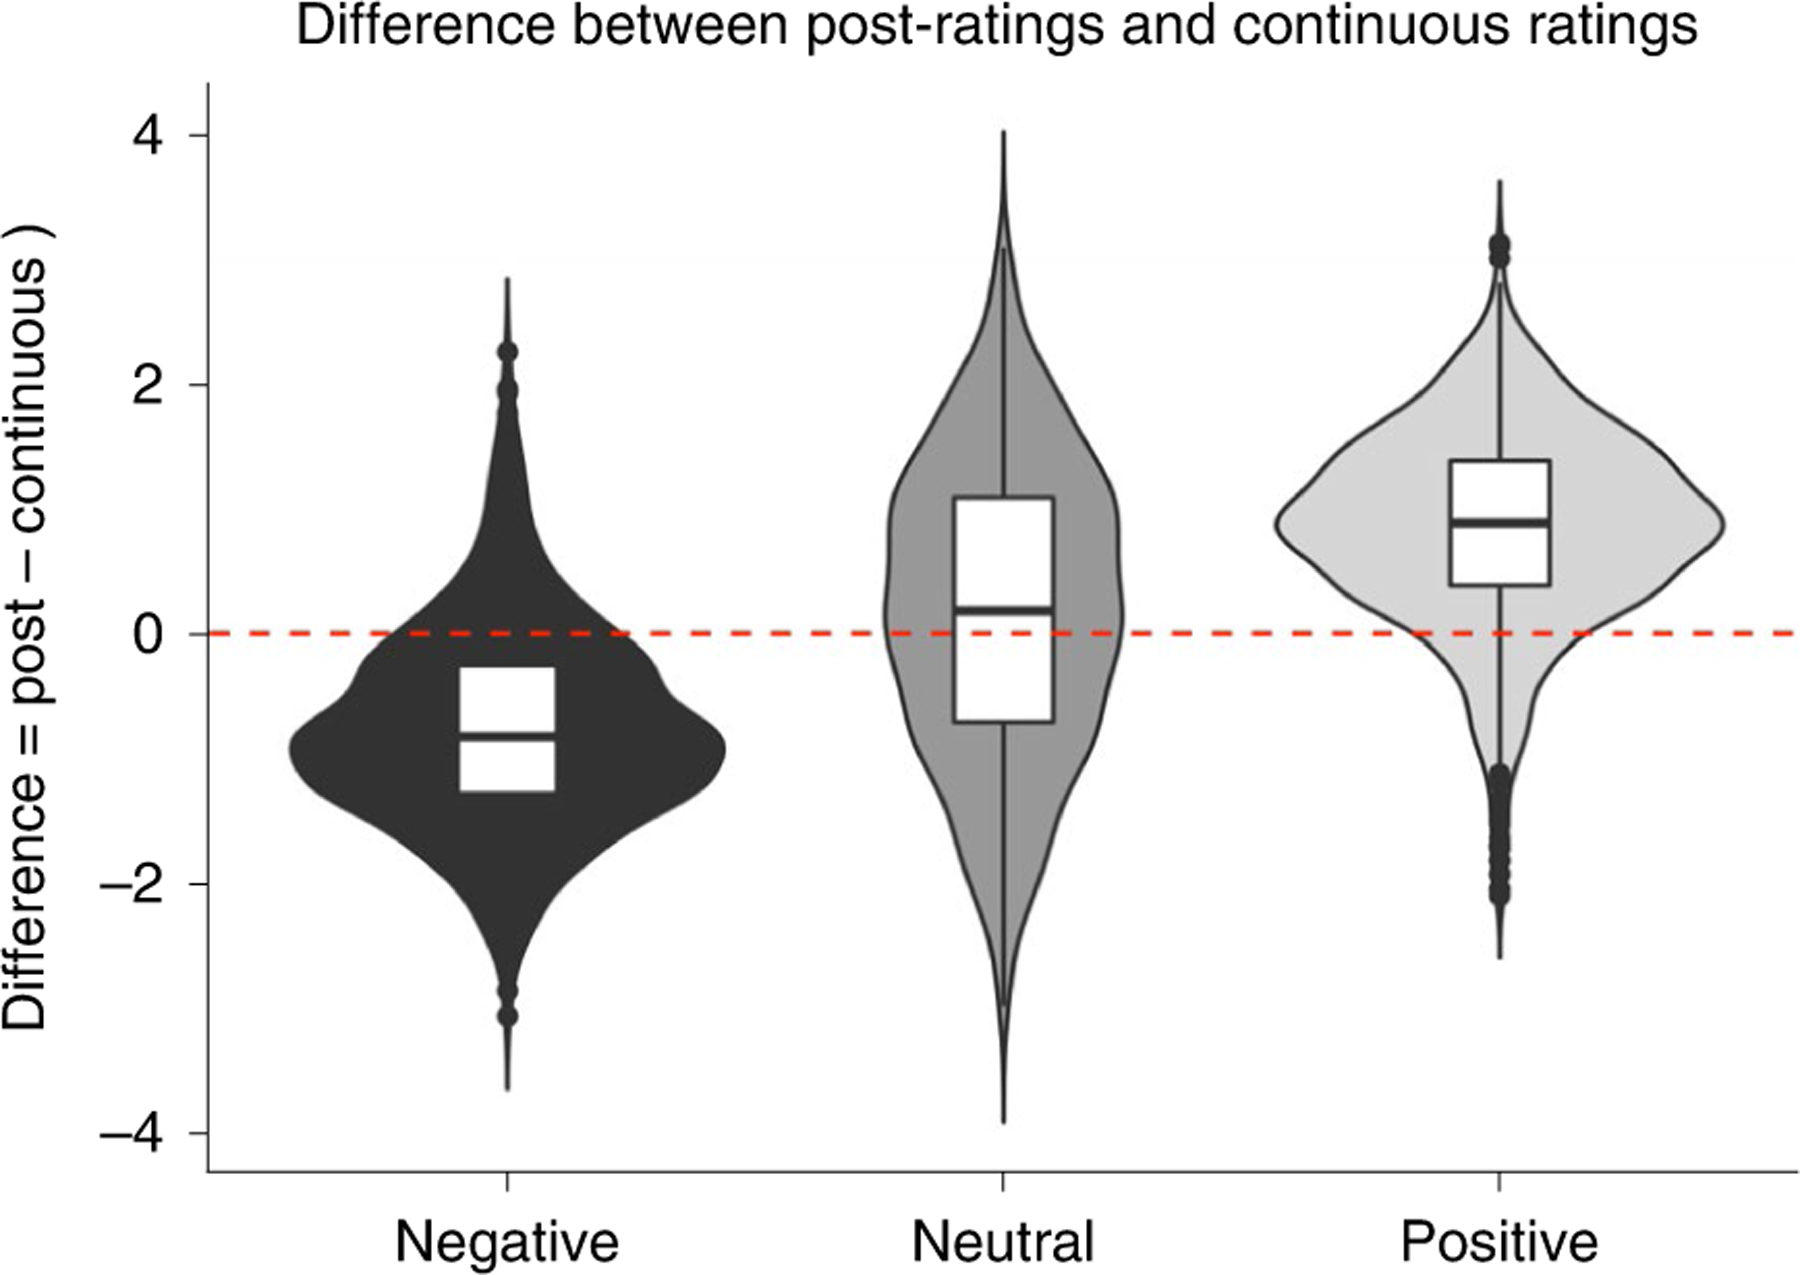
Fig. 3 |. The difference between post-ratings and continuous ratings for the three types of videos in Study 9 (N = 565): neutral, negative and positive.

The data are presented as median values. The boxes represent the interquartile range (IQR). The lines represent the first quartile − 1.5 IQR and the third quartile + 1.5 IQR. The dots represent all participants ouside that range. Comparison between the conditions was done using mixed models (t-test). A positive number indicates that the post-rating was more positive than the average continuous rating, and a negative number indicates that the post-rating was more negative than the continuous rating.
