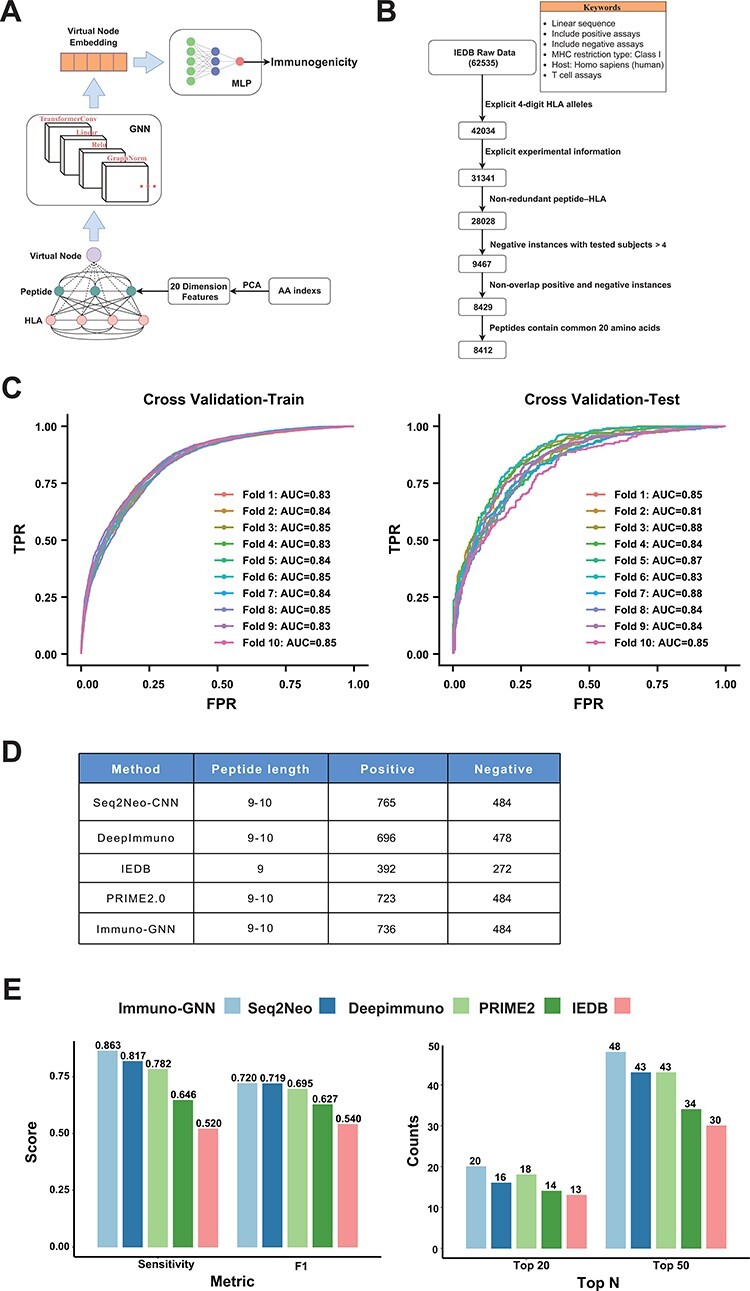
Figure 5.

GNN model for immunogenicity prediction. (A) Architecture of the model for predicting immunogenicity based on GNNs (Immuno-GNN). (B) The step-by-step training data filter process, (C) ROC curve of Immuno-GNN on 10-fold cross-validation of the filtered IEDB training dataset. ROC, receiver operating characteristic; AUC, area under curve; TPR, true-positive rate; FPR, false-positive rate. (D) Validation data summary of different immunogenicity prediction tools, these data were extracted from our Neodb database. (E) Comparison of multiple immunogenicity prediction tools based on our collection of validated neoantigen data.
