Figure 2.


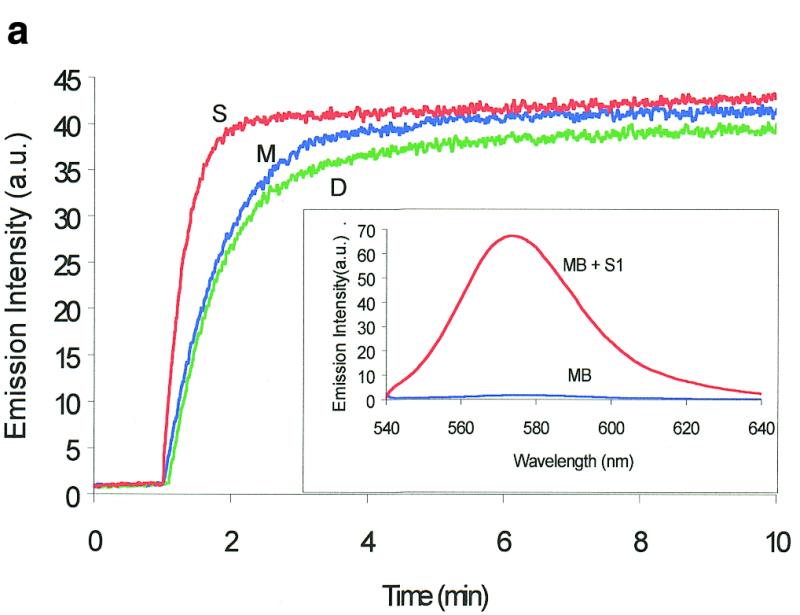
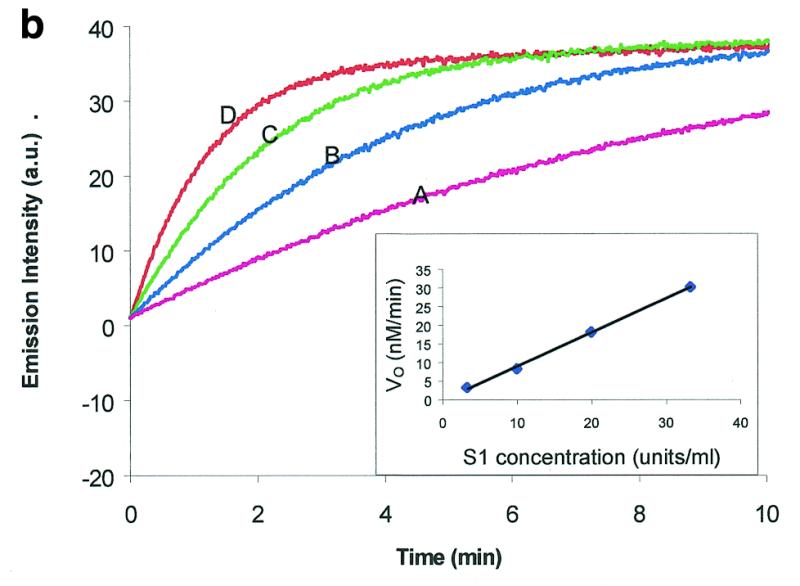
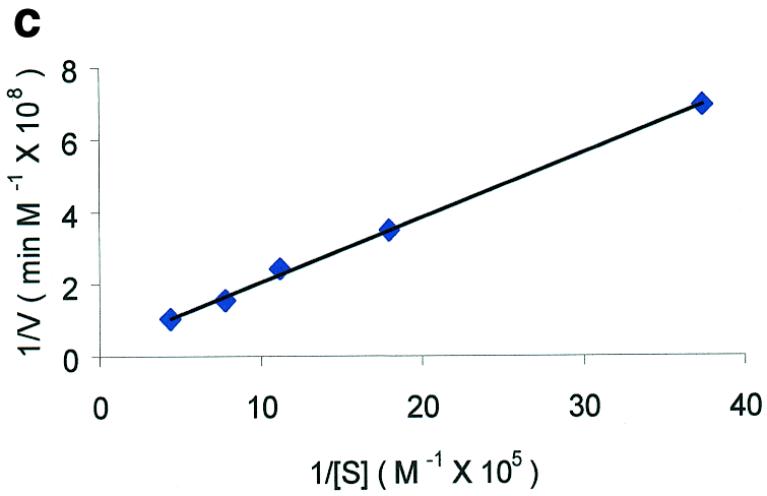
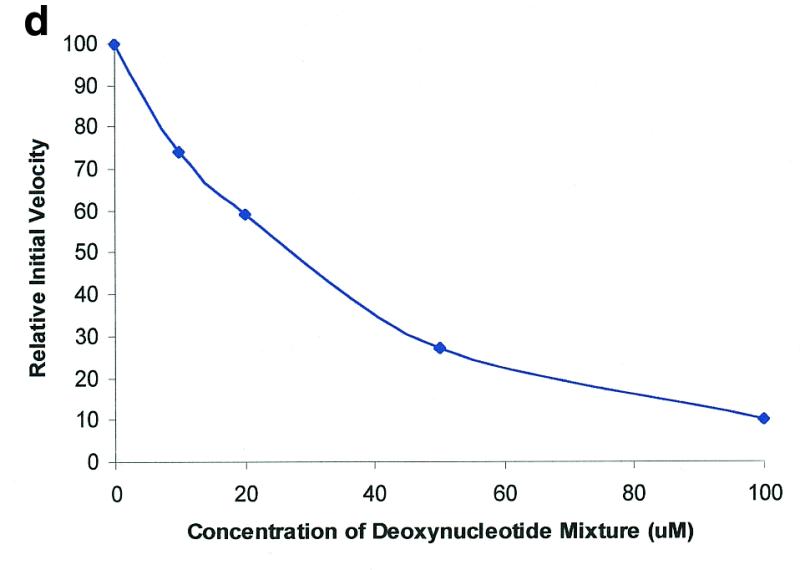
Molecular beacon assay for the cleavage of single-stranded DNA. All cleavage reactions catalyzed by S1 (Promega, Madison, WI) and mung bean (New England Biolabs, Beverly, MA) nucleases were carried out in a buffer consisting of 50 mM NaAc, pH 5.0, 30 mM NaCl, 1 mM ZnSO4. The cleavage buffer for DNase I (Sigma, St Louis, MO) was similar except that ZnSO4 was replaced by 2 mM MgCl2. All reactions were performed at 37°C. All excitation and emission wavelengths for time curves were 558 and 580 nm, respectively, except that 530 nm excitation was used for the emission spectrum. (a) Time curves of the fluorescence intensity of the molecular beacon during digestion by several nucleases. S, M and D represent S1 and mung bean nucleases and DNase I, respectively. (Inset) Fluorescence spectrum of the molecular beacon before (molecular beacon) and after digestion (molecular beacon + S1). [Molecular beacon] = 500 nM; [S1 nuclease] = 200 U/ml; [DNase I] = 1.6 U/ml; [mung bean nuclease] = 500 U/ml. (b). Time curves of cleavage of the molecular beacon by S1 nuclease at different enzyme concentrations. (Insert) Initial cleavage velocity as a function of increasing S1 concentration. [Molecular beacon] = 50 nM; 1 U of S1 nuclease = 7.8 × 10⁻¹⁴ mol. (c) Lineweaver–Burk plot of the cleavage reaction of molecular beacon by S1 nuclease. [S1 nuclease] = 0.015 nM. The concentration of molecular beacon was changed from 120 to 2300 nM. (d) Inhibitory effect of deoxynucleoside triphosphates (dNTP) on the initial cleavage velocity of the molecular beacon by S1 nuclease. [Molecular beacon] = 100 nM; [S1 nuclease] = 10 U/ml. The dNTP solution contained equal moles of dATP, dGTP, dTTP and dCTP.
