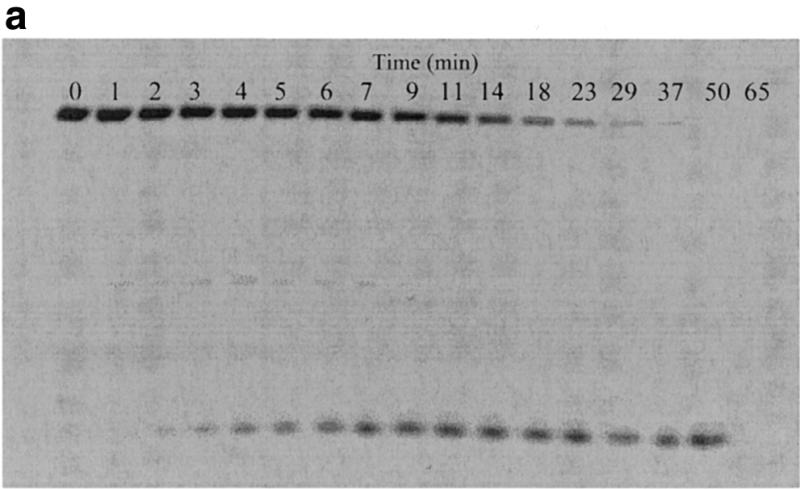
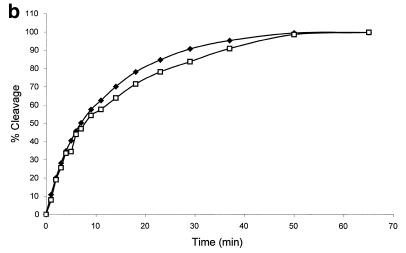
Figure 3.

Correlation of fluorescence assay and gel electrophoresis assay for the cleavage of the molecular beacons by S1 nuclease. The reactions were performed as described in Figure 2 with the following changes: 6 µM molecular beacon, 20 U/ml S1, 400 µl reaction volume. The time driving curve was recorded after the addition of 0.8 µl of S1 into the molecular beacon solution. For the gel electrophoresis assay, 10 µl samples of the reaction mixture were removed at specific time points from the fluorescence cuvette and added to 4 µl of 1 M Tris–HCl buffer (pH 7.8) on ice to quench the reaction. (a) Polyacrylamide gel assay for cleavage of the molecular beacon by S1 nuclease. The samples were run on a 15% denaturing polyacrylamide gel to separate the cleaved products from the substrate. Fluorescence image was taken by exciting the fluorophore in the molecular beacon or in the cleaved fragments. The upper band represents the uncleaved molecular beacon and the reaction time points (min) are presented above the bands. (b) Comparison of percentage of molecular beacon cleavage between the fluorescence assay (closed diamonds) and the gel electrophoresis assay (open squares). The fluorescence assay curve was extracted from the time driving curve, while the percentage of substrate cleavage at each time point for the gel electrophoresis assay was determined by quantifying the fluorescence decrease of the intact substrate relative to the total fluorescence using Bio-Rad Gel Doc 1000®.

