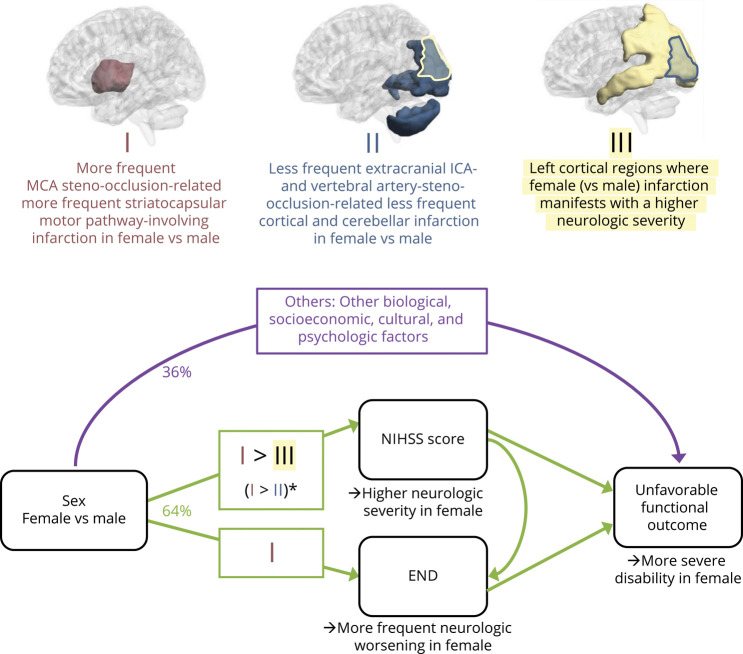
Figure 5. Graphical Representation of Proposed Mechanisms of Sex Difference in Stroke Manifestation and Outcomes.
This diagram was generated based on our results from the multivariable statistical and brain mapping and the literature on other biological,36-38 socioeconomic,39,40 cultural,41 and psychological42 factors. The middle occipital cortex is outlined in II (yellow) and III (blue) to show the overlapping region. > Comparison of the strength of the effect of 2 significant factors, based on the comparison of corresponding β coefficients from the multivariable brain mapping–related regression analyses (Figure 4). *In older patients (older than 52 years). END = early neurologic deterioration; ICA = internal carotid artery; MCA = middle cerebral artery; NIHSS = NIH Stroke Scale.

