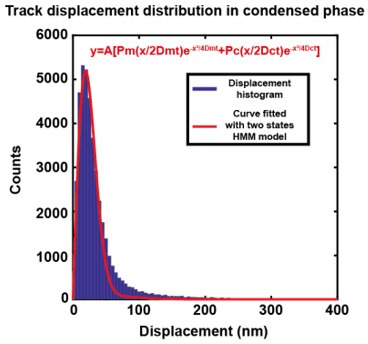
Author response image 1. Comparing fitting the experimental molecular displacements with a simple Brownian diffusion model (Figure 3—figure supplement 1C1) against fitting with the optimized HMM two-state diffusion model.

Best fit of the same experimental displacement distribution in condensed phase with a two-state HMM model. Red Curve is the HMM model fit obtained by non-linear least squares method using MATLAB. R2 = 0.98, RMSE = 184.9..
