. 2023 Jun 15;24(6):485–495. doi: 10.1631/jzus.B2200562

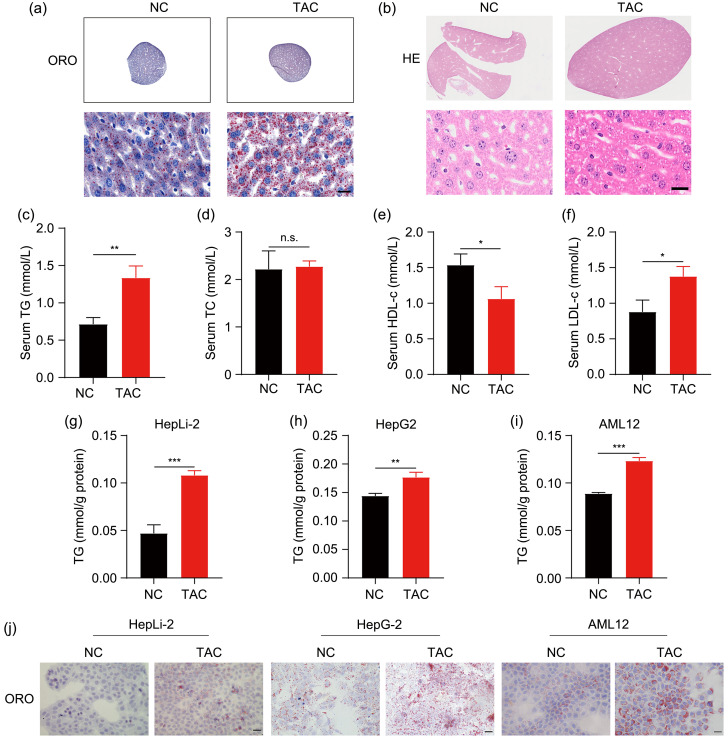
Fig. 1. Induction of hepatic lipid accumulation and hypertriglyceridemia by TAC. (a, b) Representative ORO and HE staining results of liver sections after TAC treatment for eight weeks. (c‒f) TG, TC, HDL-c, and LDL-c levels in mouse plasma. (g‒i) TG contents of the three cell lines (HepLi-2, HepG2, and AML12) after TAC treatment for 48 h. (j) Representative ORO staining results of the three cell lines. Scale bar=20 μm. Data are shown as mean±SD, n=3. * P<0.05, ** P<0.01, *** P<0.001; n.s.: not significant. HE: hematoxylin-eosin; ORO: Oil Red O; TAC: tacrolimus; NC: negative control; TC: total cholesterol; TG: triglyceride; LDL-c: low-density lipoprotein cholesterol; HDL-c: high-density lipoprotein cholesterol; SD: standard deviation.

Fig. 1