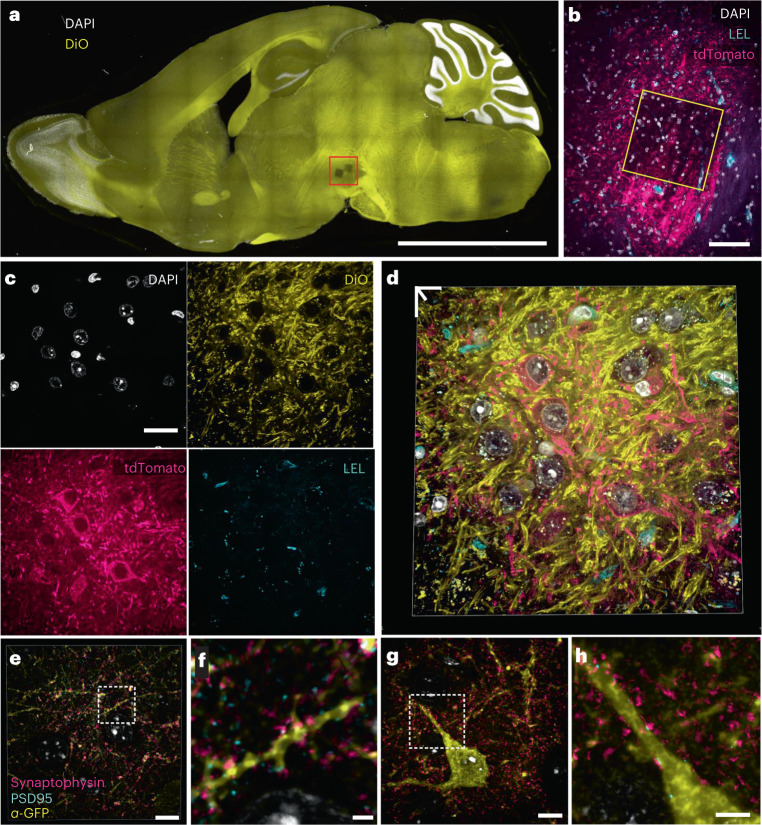
Fig. 4. Visualization of endogenous fluorophores with Magnify.
a, Maximum intensity projection of a sagittal mouse brain section expanded with Magnify-ProK. Yellow, DiO; White, DAPI. EF = 4.5× in PBS. b, Zoom in of boxed region in a showing imaged field in subsequent panels. Endogenous tdTomato can be seen in dopaminergic neurons in the ventral tegmental area. Cyan, Lycopersicon esculentum Lectin; magenta, crimson-tdTomato; white, DAPI. c, Zoom in of boxed region in b showing individual channels. d, 3D reconstruction of merged panels from c. e, 3D reconstruction of an SST cell in a fully expanded mouse cortex expanded with Magnify and homogenized with hot surfactant solution. Endogenous SST–GFP signal was recovered with an anti-GFP antibody applied postexpansion. Yellow, anti-GFP; cyan, PSD95; magenta, synaptophysin; white, DAPI. Synaptic markers close to GFP signal have been highlighted. EF = 9× in ddH2O. f, Zoom in of boxed region in e showing synapses on dendritic spines. g, Single z plane of a fully expanded SST neuron in mouse cortex from the same sample as e. h, Zoom in of boxed region in e showing synapses onto SST dendrite. Scale bars, a, 2.5 mm; b, 50 µm; c, 20 µm; d, 13 µm; (e,g, 5 µm; f,h, 2 µm. Scale bars are all in biological scale.

