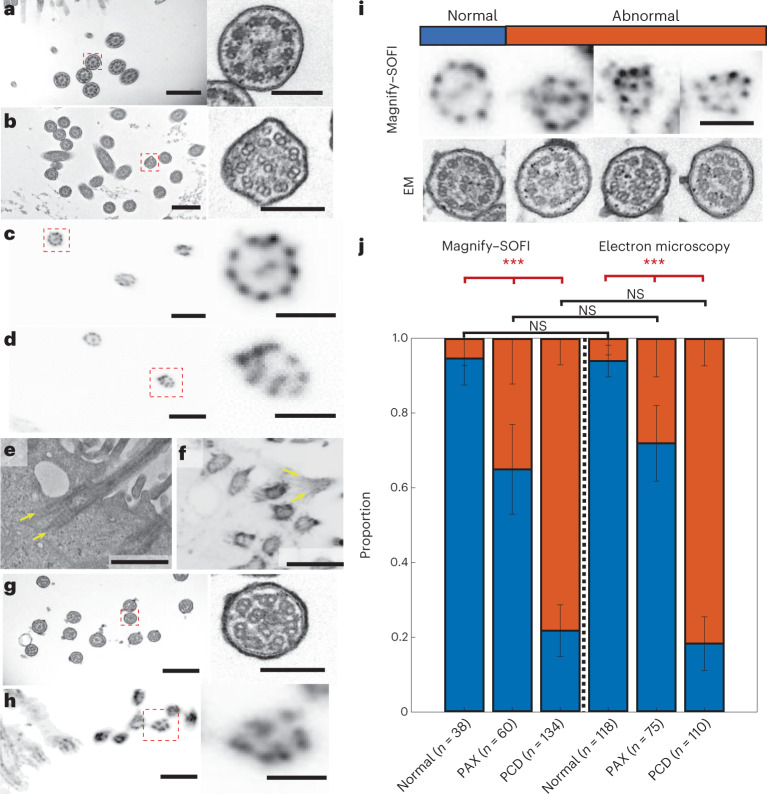
Fig. 6. Magnify–SOFI visualizes subtle nanoscale drug-induced changes.
a, Electron micrograph of cilia in normal human stem-cell-derived lung organoid. Right, zoomed in image as indicated by dashed red line boxes. b, similar to a, except the lung organoid was treated with Paclitaxel. c, Magnify–SOFI image of cilia from the same type of tissue as a, stained with Cy3-conjugated NHS ester. Right, zoomed in image as indicated by dashed red line boxes. d, Similar to c, except the lung organoid was treated with Paclitaxel. e, Electron micrograph of a basal body with prominent rootlets. f, Confocal image of corresponding basal body from the same type of tissue as e, expanded by Magnify and processed with SOFI. g, Electron micrograph of cilia in human stem-cell-derived lung organoid from CCDC39 mutation-bearing human bronchial basal stem-cell-derived lung organoids. Right, zoomed in image as indicated by dashed red line boxes. h, Magnify–SOFI image of cilia in similar tissue as g. i, Side-by-side comparison between Magnify–SOFI images (top) and electron micrographs (bottom) of cilia with and without defects. j, Stacked bar chart of proportions of normal and abnormal cilia in normal, taxol-treated (denoted as PAX samples), and CCDC39 mutation-bearing human bronchial basal stem-cell-derived lung organoids (denoted as PCD samples). Three bars on the left were based on Magnify–SOFI images while the three on the right were based on electron micrographs. Error bars, s.e.m. Scale bars, a, 600 nm; b,c, 100 nm; d, 800 nm; e,f, 100 nm; g,h, 800 nm; i, 200 nm; same for both Magnify–SOFI and EM images. Scale bars are all in biological scale.

