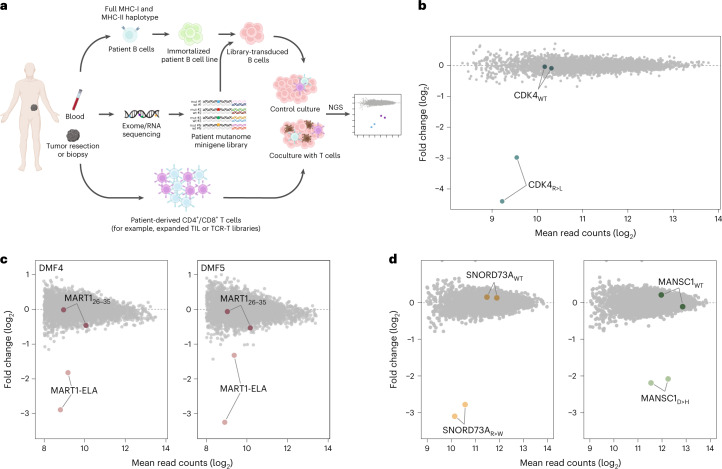
Fig. 1. Overview and validation of neoantigen discovery technology.
a, Schematic overview of the methodology. b, Antigen discovery screen of CD8+ TCR #53 T cells against immortalized HLA-A*02:01+ B cells transduced with a model antigen library of n = 4,764 minigenes. Dots represent individual minigenes. Fold change, defined as the relative abundance of minigenes in the presence of TCR #53 T cells compared with mock T cells, and mean normalized read counts are plotted for each individual minigene. Minigenes encoding the model CDK4 mutant and WT epitopes are highlighted. CDK4R24L minigenes: P = 9.4 × 10−43, P = 1.5 × 10⁻⁹. P values were generated using the DESeq2 Wald test (one-sided) and adjusted for several comparisons. c, Antigen screen using CD8+ T cells expressing either the DMF4 (left panel) or DMF5 (right panel) TCR against model library-expressing HLA-A*02:01+ B cells. Data are plotted as in b with fold change showing relative minigene abundance when exposed to either DMF4 or DMF5 TCR T cells as compared with mock T cells. DMF4 MART1-ELA minigenes: P = 1.9 × 10⁻¹², P = 1.7 × 10⁻⁹; DMF5 MART1-ELA minigenes: P = 4.1 × 10⁻¹⁴, P = 8.8 × 10⁻⁷. P values were generated as in b. d, Antigen screen using CD4+ T cells expressing patient-derived TCRs specific for the MHC class II-restricted SNORD73AR>W and MANSC1D>H against patient-matched immortalized B cells transduced with the CD74 signal-fused model library. Data are plotted as in b with fold change showing relative minigene abundance in the presence of CD4+ SNORD73A TCR or MANSC1 TCR T cells relative to mock T cells. SNORD73AR>W: P = 2.1 × 10−53; P = 2.5 × 10−44; MANSC1D>H: P = 2.1 × 10⁻²⁶, P = 3.2 × 10⁻⁸. P values were generated as in b.

