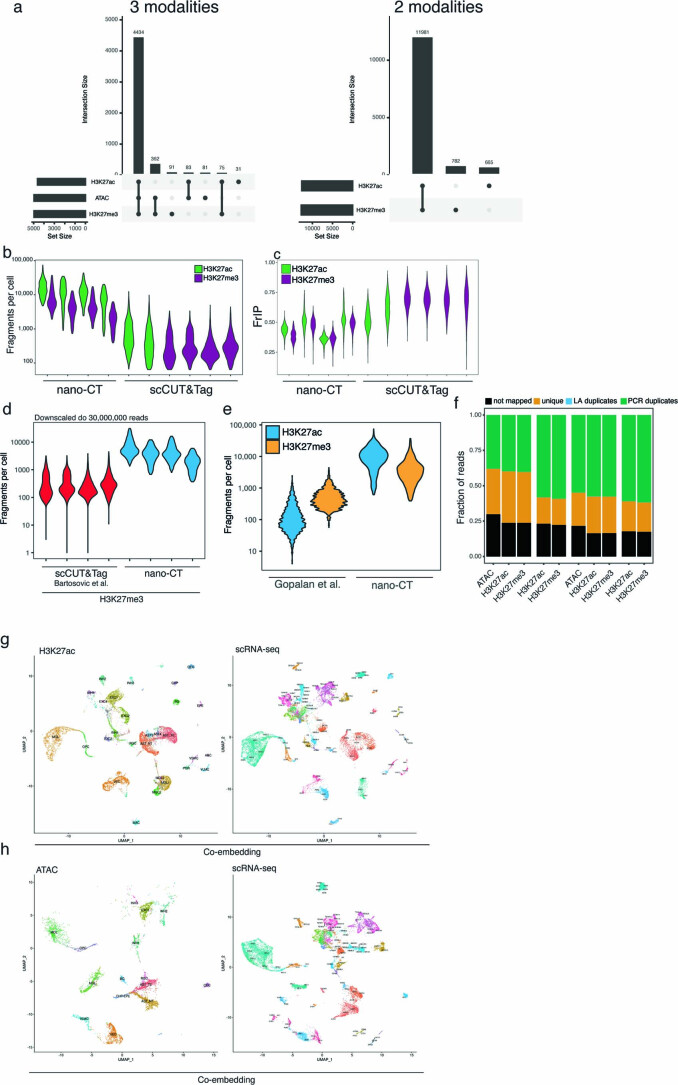
Extended Data Fig. 3. QC and integration of multimodal nano-CUT&Tag.
a. Upset plots showing the overlap between cells that pass QC within the different modalities for combinations of H3K27ac and H3K27me3, and also ATAC, H3K27ac and H3K27me3. b. Violin plot showing the distribution of fraction of reads per cell in nano-CT and scCUT&Tag. c. Violin plot showing the distribution of number of reads per in peak regions (FrIP) in nano-CT and scCUT&Tag. d. Violin plot showing the number of fragments per cell for scCUT&Tag and nano-CT datasets downscaled to 30,000,000 reads for each dataset. e. Violin plot depicting the number of fragments per cell for multi-CUT&Tag28 and nano-CT and for two modalities (H3K27ac and H3K27me3). f. Fraction of reads not mapped, unique, result of linear amplification duplicates or result of PCR duplicates in nano-CT and multimodal nano-CT experiments. g. UMAP co-embedding of CCA-integrated H3K27ac nano-CT together with scRNA-seq dataset. Gene body and promoters were used as gene activity scores for the integration. h. UMAP co-embedding of CCA-integrated nano-CT ATAC-seq together with scRNA-seq dataset. Gene body and promoters were used as gene activity scores for the integration.

