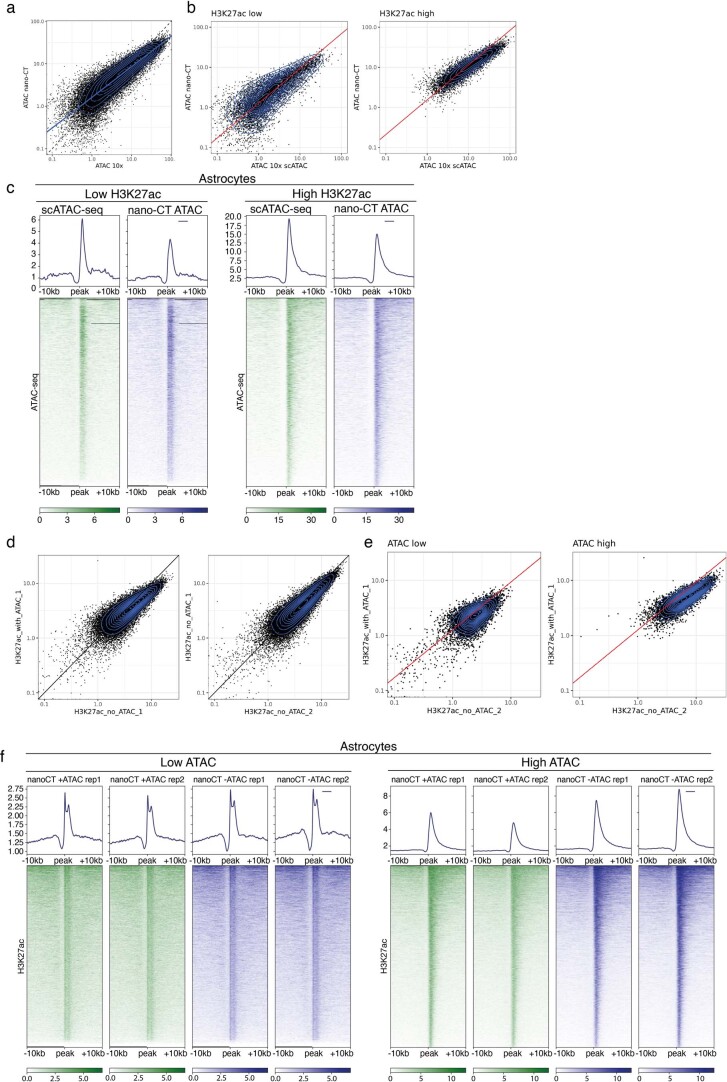
Extended Data Fig. 6. QC of cross-talk between the profiled modalities.
a. Scatter plot showing the signal of scATAC-seq (single modality profiled. from 10x Genomics) and multimodal ATAC-seq performed with nano-CT in cluster astrocytes and in astrocyte-specific peaks. b. The same scatter plot as in a.,but stratified by H3K27ac signal. H3K27ac low represents peaks with the 20% lowest quantile of H3K27ac signal and H3K27ac high represents peaks with 20% highest quantile of H3K27ac signal. c. Metagene heatmaps showing the genomic distribution of the ATAC-seq signal in the same regions as in b. d. Scatter plot showing the cluster astrocytes H3K27ac signal profiled either together with H3K27me3 (without_ATAC) or together with ATAC-seq and H3K27me3 (with ATAC) within the astrocyte-specific peaks. e. The scatter plot of H3K27ac astrocytic signal within peak regions stratified by ATAC-seq signal. ATAC low represents peaks with the 20% lowest quantile of ATAC-seq signal and ATAC high represents peaks with the 20% highest quantile of ATAC-seq signal. f. Metagene heatmaps showing the genomic distribution of H3K27ac signal in the same regions as in e.

