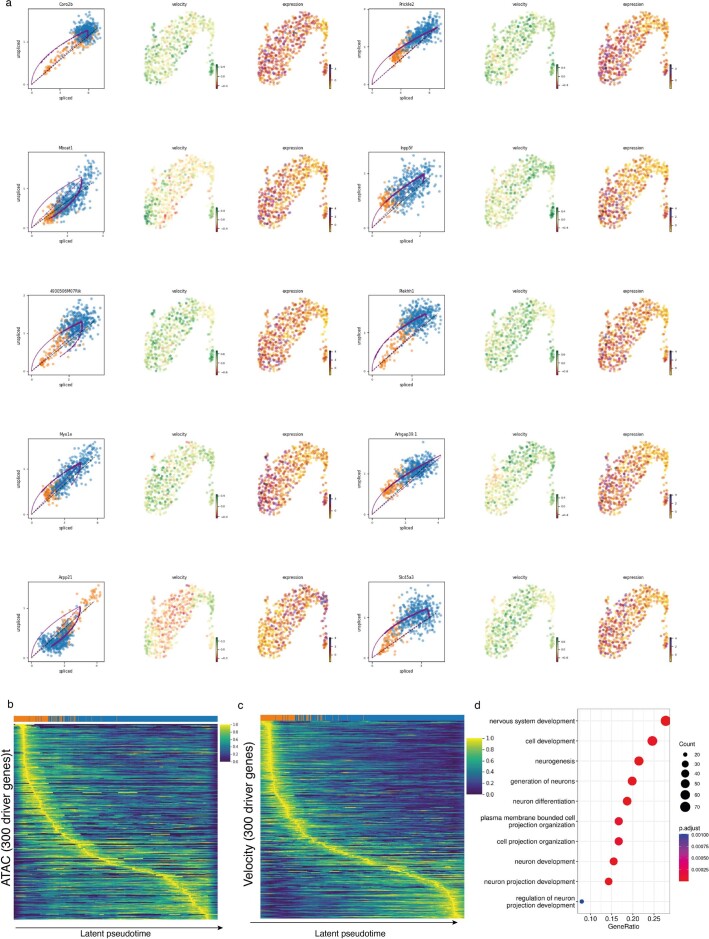
Extended Data Fig. 10. Chromatin velocity inference from nano-CUT&Tag data.
a. Phase plots of H3K27ac and ATAC, velocity and expression signal for top 10 most likely velocity driver genes identified by scvelo. b. Heatmap showing ATAC-seq signal normalized with sctransform42. Rows depict individual top velocity driver genes, sorted by time of value with maximum intensity and columns depict individual cells sorted by latent time. c. Heatmap showing the chromatin velocity. Rows depict individual top velocity driver genes, sorted by time of value with maximum intensity and columns depict individual cells sorted by latent time. d. Gene ontology enrichment analysis of the most important velocity driver genes. P value was calculated using R package enrichGO, using one sided Fischer’s test with Benjamini-Hochberg correction for multiple hypothesis testing.

