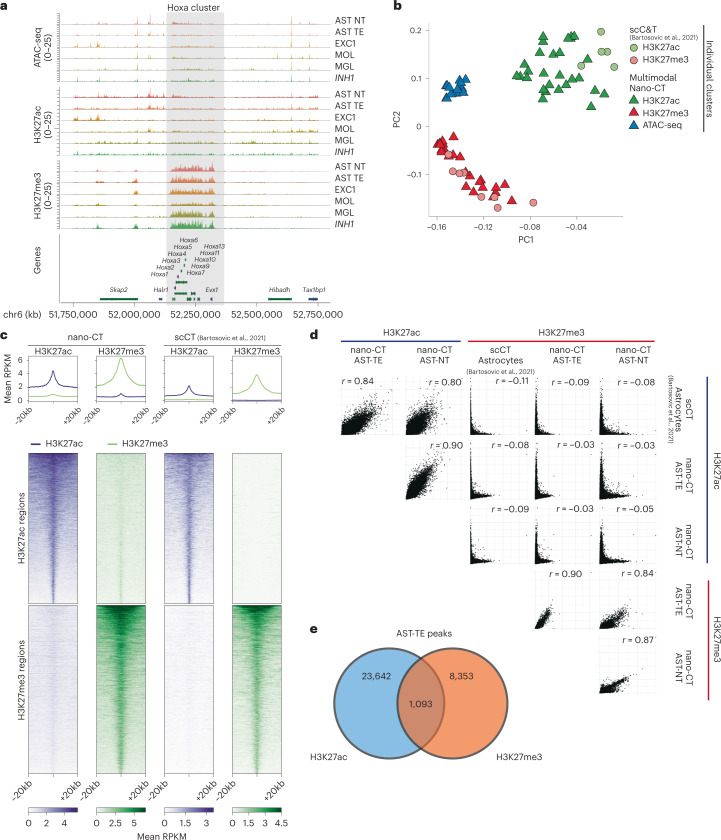
Fig. 4. Quality control and benchmarking of nano-CT.
a, Genome browser nano-CT pseudo-bulk view of the HoxA region on chromosome 6 for all three modalities. b, Principal component analysis (PCA) of pseudo-bulk tracks for each cluster identified from the respective modalities by scCUT&Tag and nano-CT. Top 50 marker regions were selected from each nano-CT cluster and modality, and all peaks were merged and flattened before running PCA. c, Metagene plots showing the signal distribution of H3K27ac and H3K27me3 in astrocyte populations obtained by nano-CT and scCUT&Tag around specific H3K27ac and H3K27me3 peaks. The peaks were defined and selected on the basis of reference scCUT&Tag data15. d, Scatter plots matrix showing correlation of H3K27ac and H3K27me3 signal in astrocyte populations defined by scCUT&Tag and nano-CT. r, Pearson correlation coefficient. Cell labels as in Fig. 2. e, Venn diagram showing the genomic overlap of significant H3K27ac and H3K27me3 peaks in cluster AST-TE.

