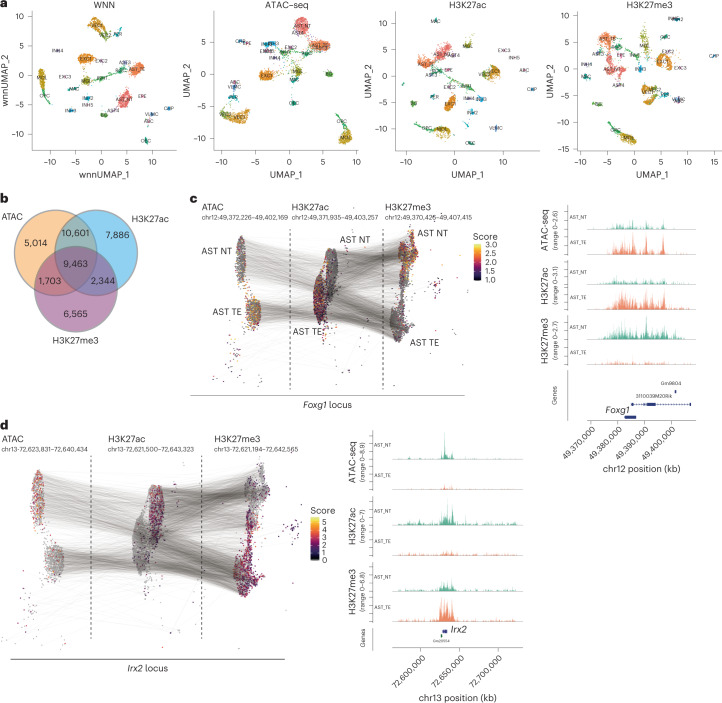
Fig. 5. Multimodal analysis and visualization of the nano-CT data.
a, UMAP embedding of the individual modalities with cluster labels identified through WNN analysis. Embedding is based on individual modalities, whereas cluster identities are assigned from WNN dimensionality reduction. b, Venn diagram showing the overlap of peaks identified from the individual modalities. c,d, UMAP projection and visualization of ATAC, H3K27ac and H3K27me3 signal intensity in single cells at the Foxg1 (c) and Irx2 loci (d). Gray lines connect the cells with same the single-cell barcodes across the different modalities. Clusters for telencephalon astrocytes (AST_TE) and non-telencephalon astrocytes (AST_NT) were selected for the visualization. Aggregated pseudo-bulk tracks for all modalities together with genomic annotations are shown to the right.

