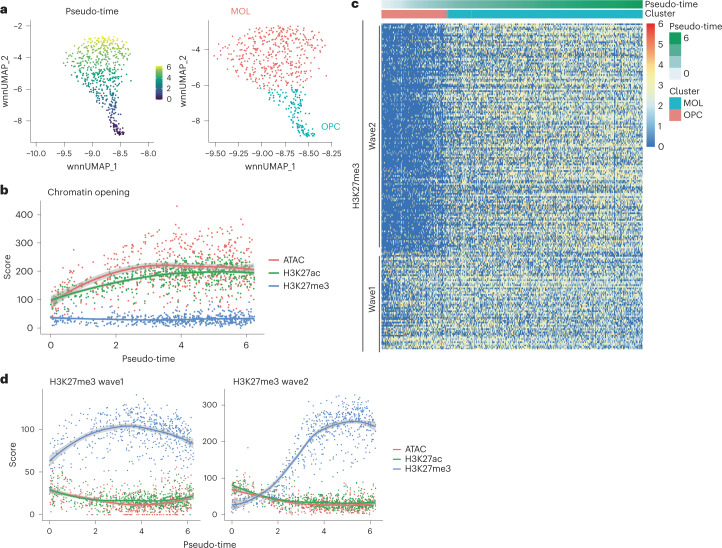
Fig. 6. nano-CT reveals sequential H3K27me3 waves during oligodendrocyte differentiation.
a, UMAP embedding showing pseudo-time calculated by slingshot on the basis of WNN dimensionality reduction and cluster identities. b, Scatter plot depicting meta-region score for all modalities (y-axis) and pseudo-time (x-axis). The score was calculated as a sum of normalized score across all regions. The regions were selected on the basis of P value (P < 0.05, Wilcoxon test) and log fold change > 0 at the marker regions of the ATAC modality, and top 200 regions were used. The line depicts local polynomial regression fit (loess) of the data and shaded regions depict 95% confidence intervals. c, Heat map representation of the H3K27me3 signal intensity at the regions the marker regions that are gaining H3K27me3 during oligodendrocytes differentiation (P < 0.05, Wilcoxon test, log fold change > 0, top 200 regions). Each column depicts one single cell and row single genomic region (peak). Cells are ordered by pseudo-time calculated as shown in a. The order of the regions is based on k-means clustering of the matrix with k = 2. d, Scatter plots depicting meta-region score for all modalities (y-axis) and pseudo-time (x-axis). The score was calculated as a sum of normalized score across all regions. The regions were selected on the basis of P value (P < 0.05, Wilcoxon test) and log fold change > 0 at the marker regions of the H3K27ac modality, and top 200 regions were used. The regions were further stratified to wave 1 and wave 2 regions on the basis of k-means clustering as shown in c. The line depicts local polynomial regression fit (loess) of the data and shaded regions depict 95% confidence intervals.

