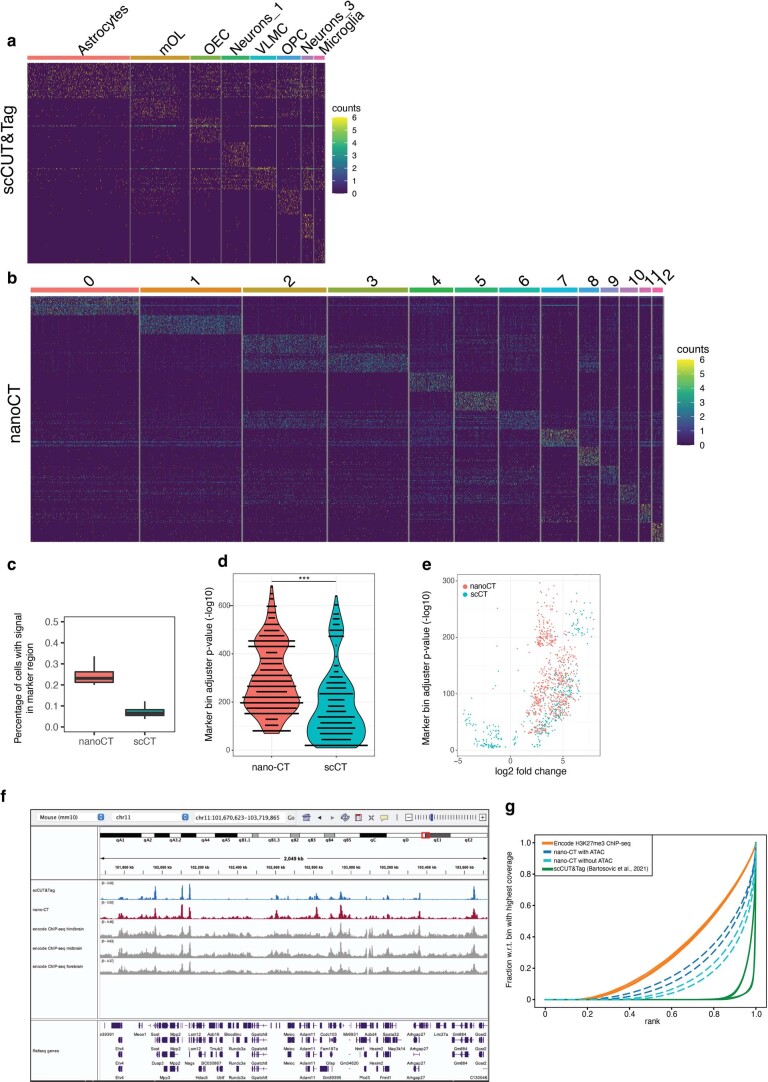
Extended Data Fig. 2. Benchmarking and QC of marker regions identified by nano-CUT&Tag.
a. Heatmap showing the cell by marker matrix for scCUT&Tag dataset. Top markers were selected based on adjusted p-value calculated using Seurat’s FindAllMarkers function (two-sided Wilcoxon rank sum test and corrected for multiple hypothesis testing by Bonferroni correction). b. Heatmap showing the cell by marker matrix for nano-CT dataset. Top markers were selected based on adjusted p-value calculated using Seurat’s FindAllMarkers function (two-sided Wilcoxon rank sum test and corrected for multiple hypothesis testing by Bonferroni correction). c. Boxplot depicting fraction of cells with any signal (counts >1) in the most significantly enriched marker regions (top 100) for the respective cluster. Markers are selected based on adjusted p-value calculated using Seurat’s FindAllMarkers function (two-sided Wilcoxon rank sum test and corrected for multiple hypothesis testing by Bonferroni correction). Lower and upper bounds of boxplot specify 25th and 75th percentile, respectively, and lower and upper whiskers specify minimum and maximum, respectively, no further than 1.5× interquartile range. Outliers are not displayed. d. Violin jitter plot showing the p-value determined by two-sided Wilcoxon rank sum test (Seurat FindAllMarkers function), distribution for the top 50 marker bins for each cluster of nano-CT and scCUT&Tag dataset. *** p value = 1.3×10⁻³⁴ (Two sided wilcoxon rank sum test) e. Volcano plot showing p-value determined by two sided wilcoxon rank sum test (Seurat FindAllMarkers function) and average log2 fold change for top 50 marker bins in nano-CT and scCUT&Tag. f. Genome browser snapshot showing pseudobulk scCUT&Tag, nano-CT and Encode dataset (forebrain, midbrain and hindbrain) for H3K27me3 histone mark. g. Fingerprint analysis of H3K27me3 pseudobulk scCUT&Tag, nano-CT and encode datasets.

