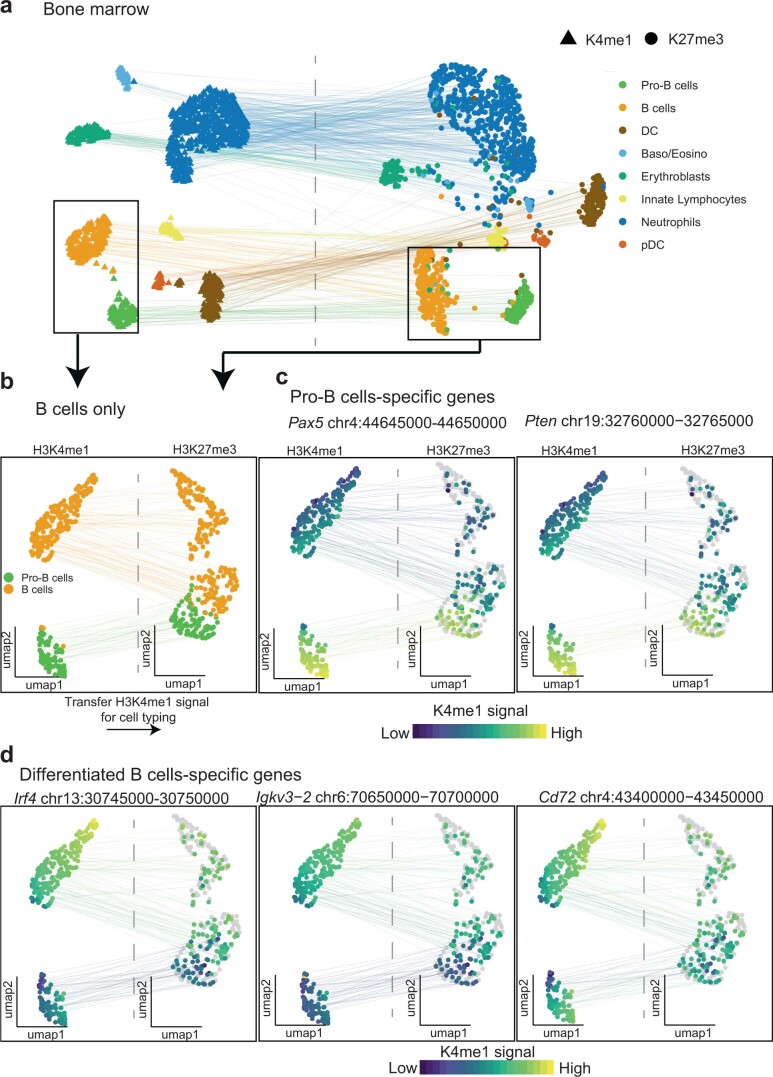
Extended Data Fig. 6. Re-clustering on B cells reveals heterogeneity within B cells.
(a) UMAP visualization of H3K4me1 and H3K27me3 (single signal and unmixed signal), colored by cell types derived from H3K4me1 and transferred to H3K27me3. Black rectangle indicates the B cell population used to re-cluster in (b,c,d). (b) UMAP of pro-B and B cells only. (c,d) Projection of H3K4me1 signal of marker genes for pro-B (c) or for differentiated B cells (d). H3K4me1 signal is measured in all cells of the H3K4me1 UMAP (that is both single- and double-incubated have H3K4me1 signal in the H3K4me1 UMAP). Double- (colored) but not single-incubated (grey) cells have H3K4me1 signal in the H3K27me3 UMAP.

