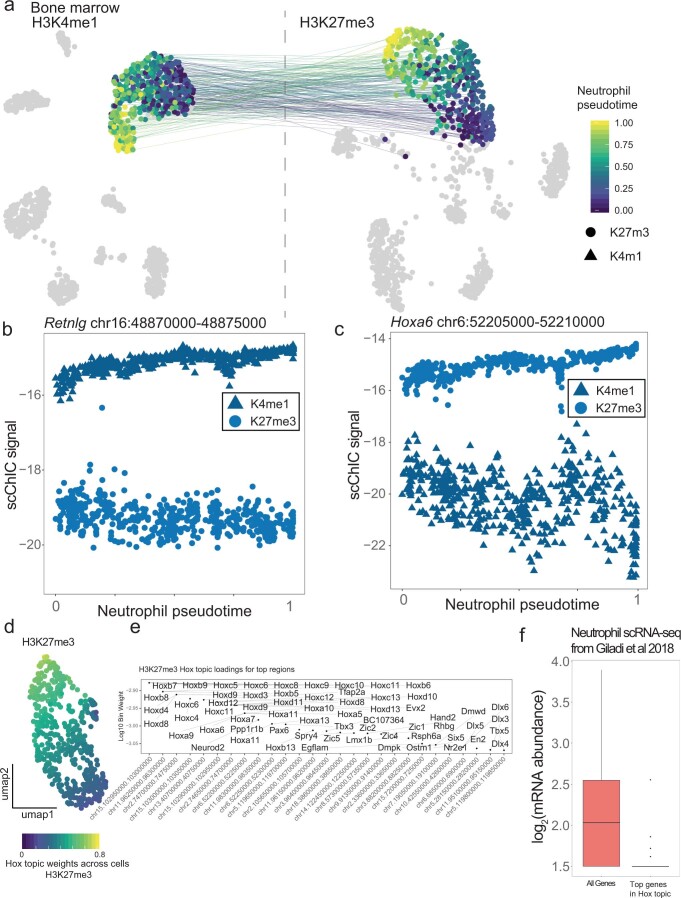
Extended Data Fig. 7. H3K4me1 and H3K27me3 signal during neutrophil maturation.
(a) UMAP visualization of H3K4me1 and H3K27me3, lines join H3K4me1 and H3K27me3 UMAPs of double-incubated neutrophils. Heterogeneity within neutrophils are colored as neutrophil pseudotime. (b) H3K4me1 and H3K27me3 modification levels at the Retnlg (a mature neutrophil marker gene) locus along neutrophil pseudotime. (c) H3K4me1 and H3K27me3 modification levels at the Hoxa along neutrophil pseudotime. (d) UMAP of H3K27me3 signal across single cells colored by weights of a topic containing high H3K27me3 levels at many Hox and developmental gene loci (Hox topic). (e) Topic weights of the top 150 genes associated with loci in the Hox topic for H3K27me3. (f) Neutrophil mRNA abundance of genes in the Hox topic compared to other genes derived from publicly available scRNA-seq data25. Number of genes per boxplot: n=17986 for All Genes, n=127 for genes in the Hox topic. Boxplots show 25th percentile, median and 75th percentile, with the whiskers spanning 97% of the data.

