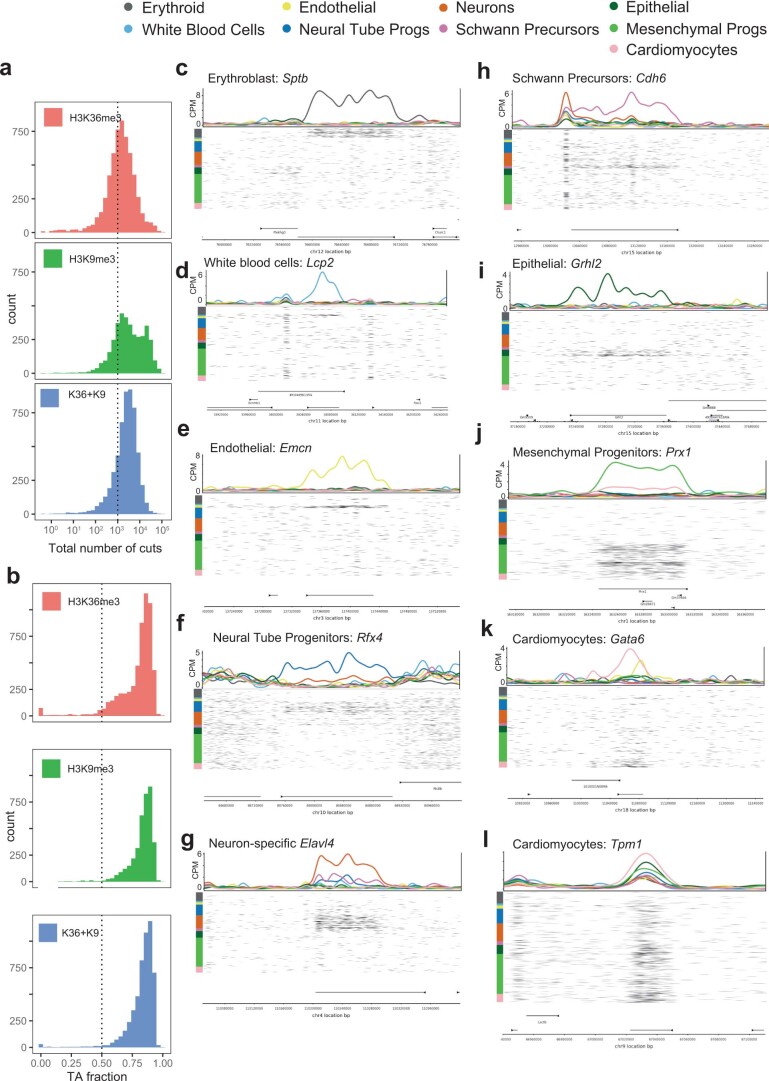
Extended Data Fig. 8. Cell typing mouse organogenesis dataset using H3K36me3 using marker genes.
(a) Histogram of unique fragment cuts per cell. (b) Histogram of fraction of unique fragments starting with a "TA" motif. (c-l) Genome browser plots of cell type-specific H3K36me3 loci showing pseudobulk CPM signals (colored lines, top) and cut locations of individual cells (bottom, black marks). Cells are ordered by cell type (color-coded on the left).

