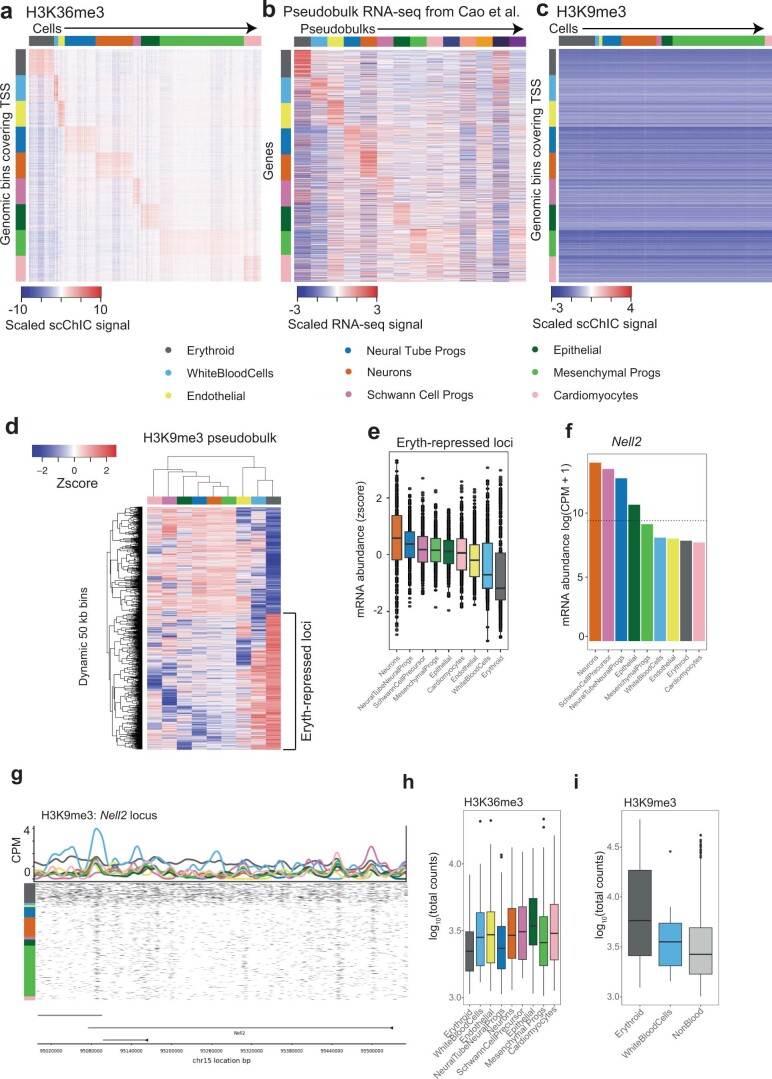
Extended Data Fig. 9. H3K9me3-specific regions across cell types.
(a) Heatmap of H3K36me3 signal for the top 250 H3K36me3-specific loci (rows) across cell types (columns). (b) Heatmap of mRNA abundances for the genes associated with the H3K36me3-specific loci in (a) across pseudobulks. Data processed from publicly available scRNA-seq data from Cao et al.42. (c) Heatmap of H3K9me3 signal for the same top 250 H3K36me3-specific loci as in (a). The H3K36me3 and H3K9me3 heatmaps are mean-centered and scaled using a common mean and standard deviation calculated across both marks. (d) Heatmap of H3K9me3 signal across pseudobulks at H3K9me3-variable loci. (e) Relative mRNA abundances42 at n=364 genes associated with erythroblast-repressed loci across nine cell types. (f) mRNA abundance of an erythroblast-repressed gene, Nell2, across pseudobulks. (g) Genome browser plot of around the Nell2 locus, an erythroblast-specific region for H3K9me3. Top of plot is pseudobulk H3K9me3 CPM signals, below are cut locations of individual cells (black marks). Cells are ordered by cell type (color-coded as in heatmaps). (h, i) Total unique fragments across cell types for single-incubated cells for H3K36me3 (h) and H3K9me3 (i), showing that the variability of the number of cuts across cells can span orders of magnitude. Number of single-incubated H3K36me3 cells for each boxplot: n=154 erythroid, n=36 white blood cells, n=60 endothelial, n=250 neural tube progenitors, n=272 neurons, n=58 Schwann cell precursors, n=154 epithelial, n=570 mesenchymal progenitors, n=160 cardiomyocytes. For H3K9me3: n=207 erythroid, n=26 white blood cells, n=736 non-blood cell types. Boxplots in (e), (h), (i) show 25th percentile, median and 75th percentile, with the whiskers spanning 97% of the data.

