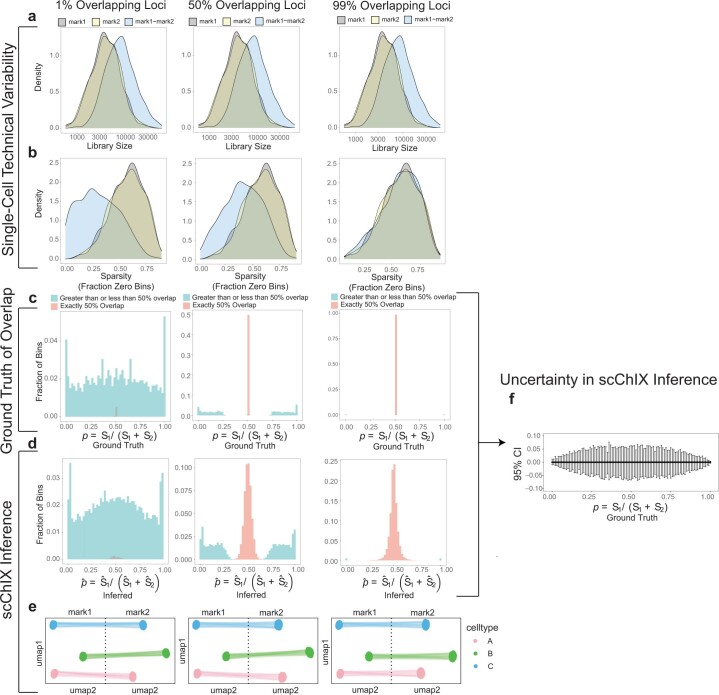
Extended Data Fig. 1. Benchmarking scChIX-seq across a range of overlapping patterns.
Left column: simulation results in a mutually exclusive scenario (that is 1% of loci are overlapping). Middle column: results for an intermediate amount of overlap (that is 50% of loci are overlapping). Right column: results for highly correlated scenario (that is 99% of loci are overlapping). (a) Distribution of unique fragment cuts per cell in simulation. (b) Sparsity of the input matrix. Note that in the mutually exclusive scenario, the double-incubated marks is less sparse than single-incubated marks because loci with zero reads in one mark often have non-zero reads in another mark. (c) Distribution of the degree of overlap (defined as fraction of double-incubated signal belonging to mark1: ) for each locus genome-wide. (d) Estimated degree of overlap from scChIX-seq. (e) UMAP representation of the three cell types underlying simulation. UMAPs from the two marks are linked by double-incubated cells that are deconvolved by scChIX-seq. (f) Empirical 95% confidence interval across the range of (from 0 to 1). Range obtained by aggregating results from the three overlapping patterns. n=101 simulation datapoints spread evenly between 0 and 1 inclusive. Error bars are empirial 95% confidence intervals, centers are the mean.

