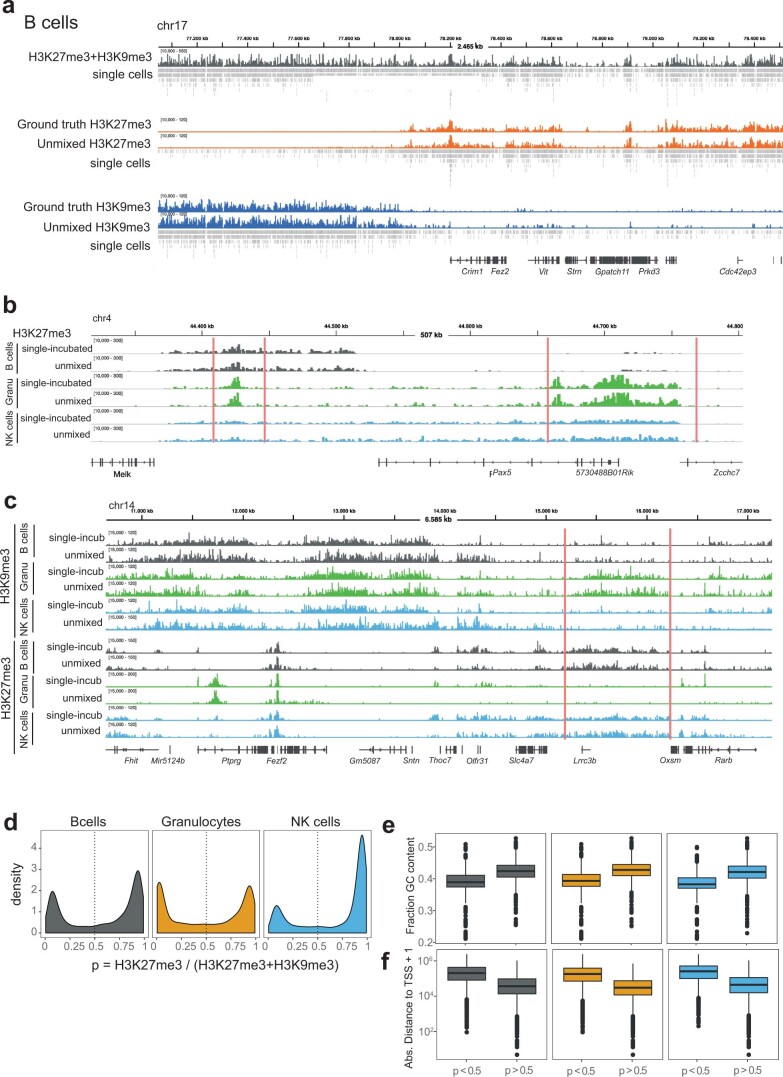
Extended Data Fig. 3. Coverage tracks of deconvolved cells and genome statistics.
(a) Coverage tracks for B cells visualizing the H3K27me3+H3K9me3, deconvolved H3K27me3 or H3K9me3, and ground truth H3K27me3 or H3K9me3 histone modification levels for three different genomic regions. Double-incubated signal in grey, H3K27me3 single, and unmixed signal in orange, and H3K9me3 single and unmixed signal in blue. Under each coverage track are cut fragments of single cells. Each row of the single cells track are cuts from an individual cell. Shown are a subset of cells, which were chosen for their high number of cuts in the region. Rows are in decreasing order of total number of cuts. (b) H3K27me3 coverage tracks showing the region around Pax5 for the ground truth H3K27me3 pseudobulk signal from single-incubated cells and for the deconvolved H3K27me3 pseudobulk signal from double-incubated cells for three cell types: B cells (grey), granulocytes (green), and NK cells (blue). (c) H3K9me3 (top) and H3K27me3 (bottom) coverage tracks showing the region around Auts2 for ground truth (single-incubated) and for the unmixed (unmixed) for B cells (grey), granulocytes (green) and NK cells (blue), respectively. d Distribution of assignment probability estimates in the genome for the three cell types. Vertical dotted lines represent cutoffs to define H3K9me3-specific (that is p < 0.5) or H3K27me3-specific regions (that is p≥0.5). e Boxplot distributions of GC content in H3K27me3-marked and H3K9me3-marked regions. f Boxplot distributions of distance to TSS in the two classes of regions. Distances are measured from the center of the 50 kb locus to the nearest TSS. Number of bins in each boxplot: n=9962 for B cells p < 0.5, n=15877 for B cells p≥0.5, n=12483 for granulocytes p < 0.5, n=13345 for granulocytes p≥0.5, n=7337 for NK cells p < 0.5, n=18491 for NK cells p≥0.5. Boxplots show 25th percentile, median and 75th percentile, with the whiskers spanning 97% of the data.

