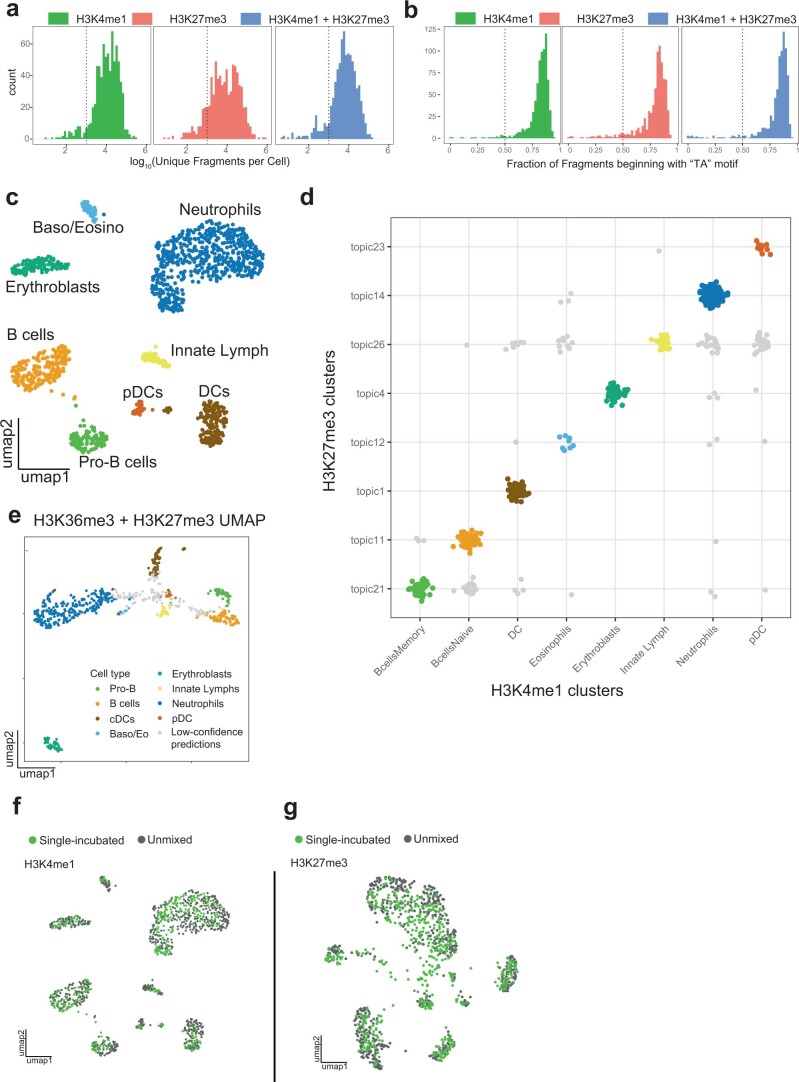
Extended Data Fig. 4. Inferring cluster pairs from H3K4me1+H3K27me3 transfers cell type labels.
(a) Histogram of unique fragment cuts per cell. (b) Histogram of fraction of unique fragments starting with a "TA" motif. (c) UMAP of H3K4me1 sortChIC data, cells colored by cell type. (d) Assignment plot showing individual H3K4me1+H3K27me3 cells (represented as dots) assigned to a pair of topics (x-axis labels are H3K4me1 clusters, named by their associated cell type, while y-axis are H3K27me3 clusters). Cells along the diagonal are high-confidence predictions that match a H3K4me1 cluster with a H3K27me3 topics, and are colored by the H3K4me1-derived cell type labels. (e) UMAP of H3K4me1+H3K27me3 sortChIC. Cells are colored by their cell type inferred from cluster pairs. Low-confidence predictions are colored in grey. (f, g) UMAP representation of H3K4me1 (f) and H3K27me3 (g). Cells are colored by whether the epigenome was generated by single-incubation or by unmixing by scChIX-seq.

