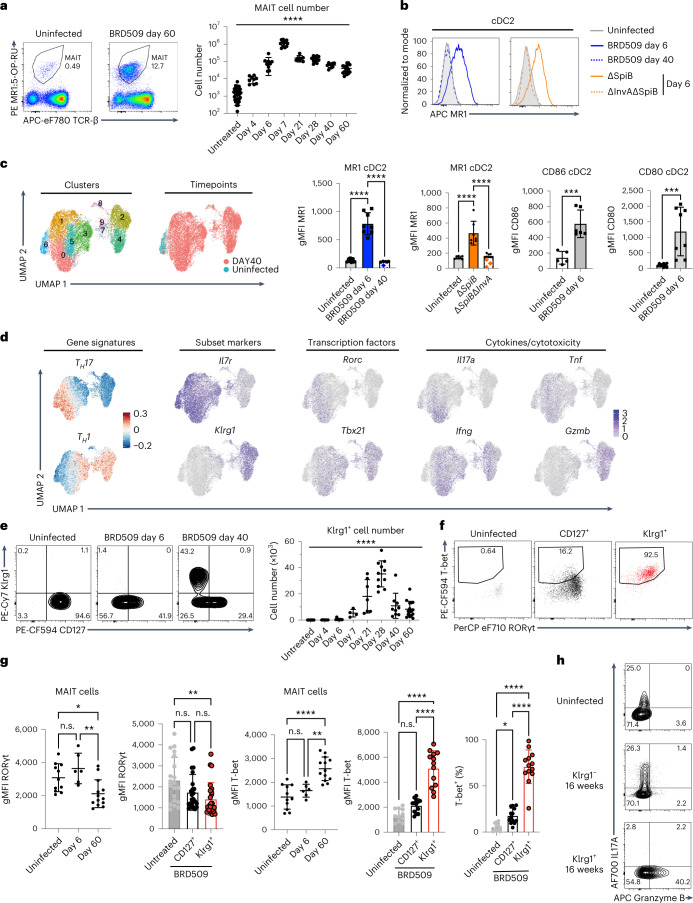
Fig. 1. A Salmonella vaccine strain induces two aaMAIT cell subsets.
MAIT cells from lungs of C57BL/6J mice were analysed at the indicated times post BRD509 vaccination by flow cytometry. a, Representative plots (left) and quantification (right) of MR1:5-OP-RU Tetramer+ TCR-β+ MAIT cells. n = 36, 9, 9, 13, 7, 11, 9 and 16 mice per group, combined from 12 independent experiments. Statistical significance assessed via one-way analysis of variance (ANOVA), ****P < 0.0001. b, Representative histograms (top) of expression of MR1 by lung cDC2 after infection at the indicated times (left) or with the indicated Salmonella strains (right). Quantification (bottom) of MR1, CD86 and CD80 expression by cDC2. n = 13, 8, 4, 7, 7, 8, 5, 6, 9 and 8 mice per group, combined from two independent experiments, statistical significance assessed via one-way ANOVA with Tukey’s multiple comparison test, ****P < 0.0001 for MR1 on DC or unpaired t-test, ***P = 0.0007 (CD86), ***P = 0.0008 (CD80). c, UMAP representations of scRNA-seq data from pulmonary MAIT cells at day 0 and day 40 post BRD509 vaccination. MAIT cells sorted from lungs pooled from ten mice per timepoint in one experiment. d, Th1 and Th17 gene signature plots (left) and feature plots for the indicated genes. e, Representative plots (left) and quantification (right) of expression of Klrg1 by lung MAIT cells at indicated times post BRD509 vaccination. n = 28, 6, 8, 4, 7, 11, 9 and 16 mice per group, respectively, combined from nine independent experiments, statistical significance via one-way ANOVA, ****P < 0.0001. f,g, Representative plots (f) and quantification (g) of RORγt and T-bet by lung MAIT cells at indicated times post BRD509 vaccination. RORγt: n = 11 (untreated), n = 6 (day 6), n = 13 (day 60), combined from three independent experiments; RORγt subsets: n = 20 (untreated), n = 25 (day 60), combined from five independent experiments. T-bet: n = 11 (untreated), n = 6 (day 6), n = 13 (day 60), combined from three independent experiments, statistical significance via one-way ANOVA with Tukey’s multiple comparisons test; left (*P = 0.0267, **P = 0.0034), left middle (**P = 0.0045), middle (****P < 0.0001, **P = 0.0013), right (*P = 0.0449, ****P < 0.0001). h, Representative cytokine production by intracellular flow cytometry by MAIT cell populations at indicated timepoints in response to PMA and ionomycin. All data displayed as mean ± s.d. Source numerical data are available in source data. n.s., not significant.

