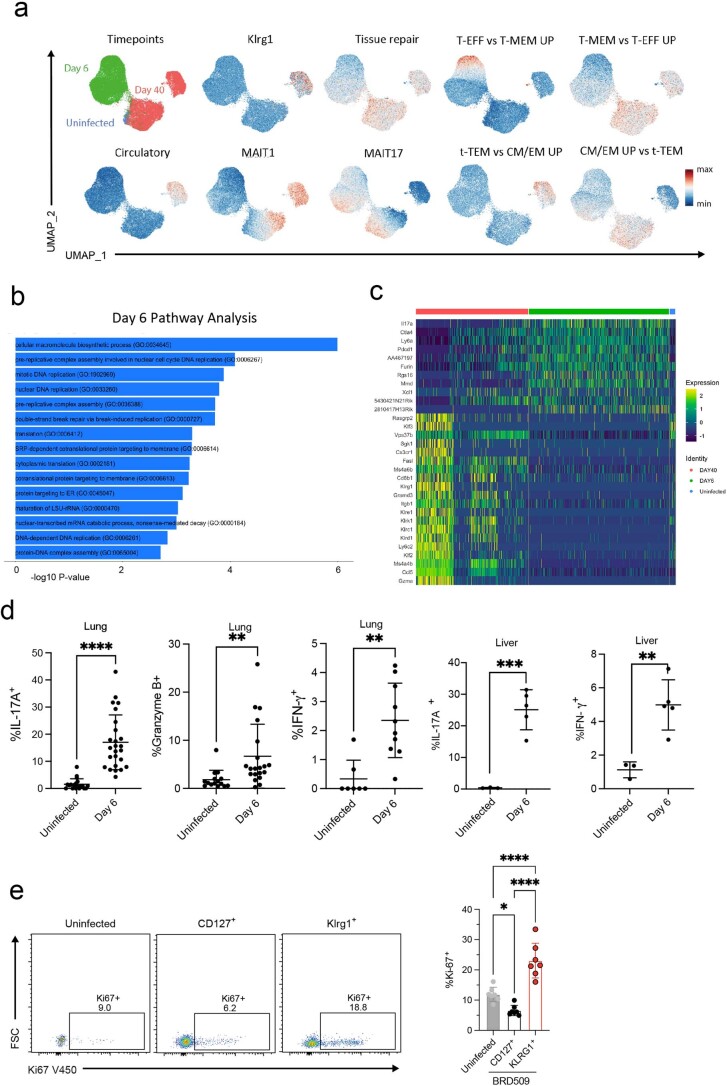
Extended Data Fig. 3. Day40 aaMAIT cell transcriptional and functional phenotype.
a) UMAP representation of day 0 and day 40 scRNA-seq data from Fig. 1c but including day 6 after infection. Expression of key genes and gene signatures as in Fig. 1d. GO terms and C7 datasets: GSE1000002_1582_200_UP, GSE1000002_1582_200_DN and Milner et al.41 b) Ingenuity pathway analysis of day 6 DE genes, ordered by -log10 P value. c) Heatmap representation of top DE genes across indicated timepoints. d) Cytokine production by intracellular flow cytometry at day 6 post BRD509 vaccination by lung and liver MAIT cells, cultured with Brefeldin A for 2 hrs but without restimulation in vitro. Data points indicate individual mice, statistics assessed via unpaired two-tailed t test. IL-17A: n = 19 (uninfected), n = 25 (day 6) mice per group, combined from 5 independent experiments, ****P < 0.0001. Granzyme B: n = 15 (uninfected), n = 20 (day 6), combined from 4 independent experiments, **P = 0.0099. IFN-γ: n = 7 (untreated), n = 10 (day 6), combined from 2 independent experiments, **P = 0.0017. Liver cytokines: n = 3 (untreated), n = 5 (day 6), ***P = 0.0006, **P = 0.0055. e) Ki-67 expression in untreated pulmonary MAIT cells and aaMAIT cells 40 days post vaccination with BRD509. n = 7 mice per group, combined from 2 independent experiments. Statistical significance via one-way ANOVA with Tukey’s multiple comparisons test. *P = 0.0388, ****P < 0.0001. All error bars represent mean ± S.E.M. Source numerical data are available in source data.

