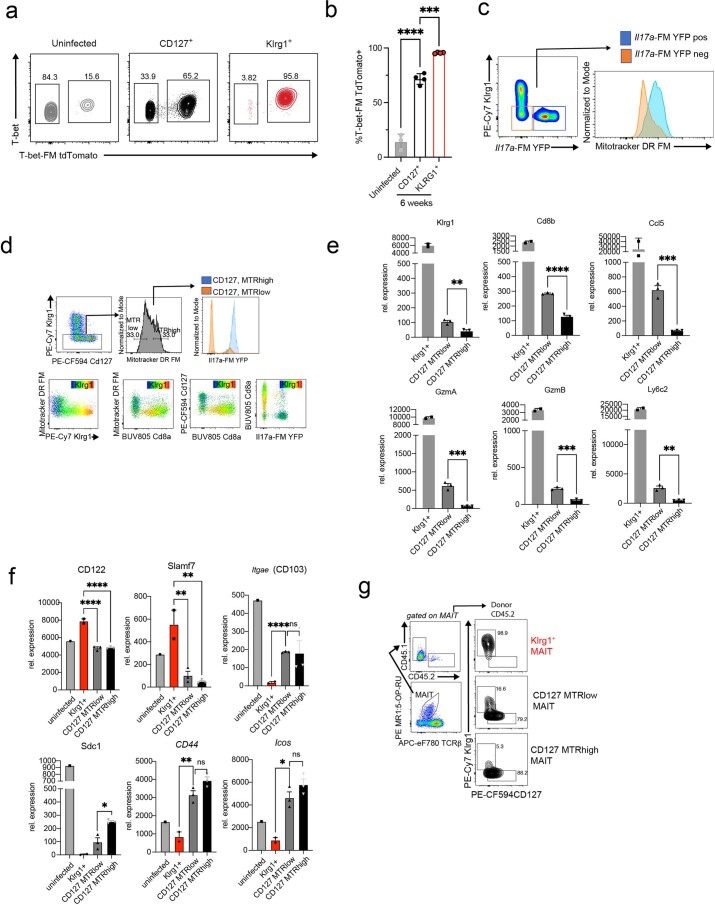
Extended Data Fig. 5. MTRlow KIrg1−aaMAIT cells may be precursors to stable aaMAIT cell subsets.
a,b) Representative histograms (a) and quantification (b) of T-bet-TdTomato fate mapper and current T-bet protein expression in indicated pulmonary MAIT cells subsets at baseline or at >40 days post BRD509 vaccination. Data displayed as mean ± S.D., n = 3, 4, 4 mice per group, respectively, representative of one experiment. Statistical significance via one-way ANOVA with Tukey’s multiple comparisons test, ****P < 0.0001, ***P < 0.0002. c) aaMAIT cells that are Klrg1– from IL17a-FM YFP mice were gated as shown at day 40 post vaccination and tested for mitochondrial ΔΨm (MitoTracker DR FM). Data representative of n = 4 mice. d) Klrg1– day 40 aaMAIT cells were separated into top/bottom 33% based on mitochondrial ΔΨm (MitoTracker DR FM) and tested for IL17a-FM YFP expression (top row). Day40 aaMAIT cell expression of indicated markers, with expression of Klrg1 overlayed as a color scale. Data representative of n = 6 mice and two independent experiments. e) Relative expression measured by bulk RNA-seq of the indicated genes in Day 40 Klrg1+ aaMAIT cells and CD127+, MTRlow and MTRhigh aaMAIT cells. Each datapoint reflects an individual mouse from one experiment. Unpaired two-tailed t tests; Klrg1 **P = 0.006353, Cd8b ****P = 0.000078, Ccl5 ***P = 0.000731, GzmA ***P = 0.000742, GzmB ***P = 0.000332, Ly6c2 **P = 0.001577. Data displayed as mean ± s.e.m. f) Relative expression measured by bulk RNA-seq of the indicated genes in naïve MAIT cells, day 40 Klrg1+ aaMAIT cells and CD127+, MTRlow and MTRhigh aaMAIT cells. Each datapoint reflects an individual mouse from one experiment. One-way ANOVA CD122 ****P < 0.0001, Slamf7 **P = 0.0047, **P = 0.0021, Itgae ****P < 0.0001, Scd1 *P = 0.009193, Cd44 **P = 0.0079, Icos *P = 0.0127. Data displayed as mean ± s.e.m. g) The indicated populations of CD45.2 donor lung aaMAIT cells at day 40 post vaccination were sorted and transferred into CD45.1 recipient mice. After gating on MR1:5-OP-RU tetramer+ TCRβ+ MAIT cells and CD45.2 (=donor) markers (left), Klrg1 and CD127 expression was plotted in recipient mice 14 days post vaccination with BRD509 (right). Representative data shown from one of two independent experiments. Source numerical data are available in source data.

