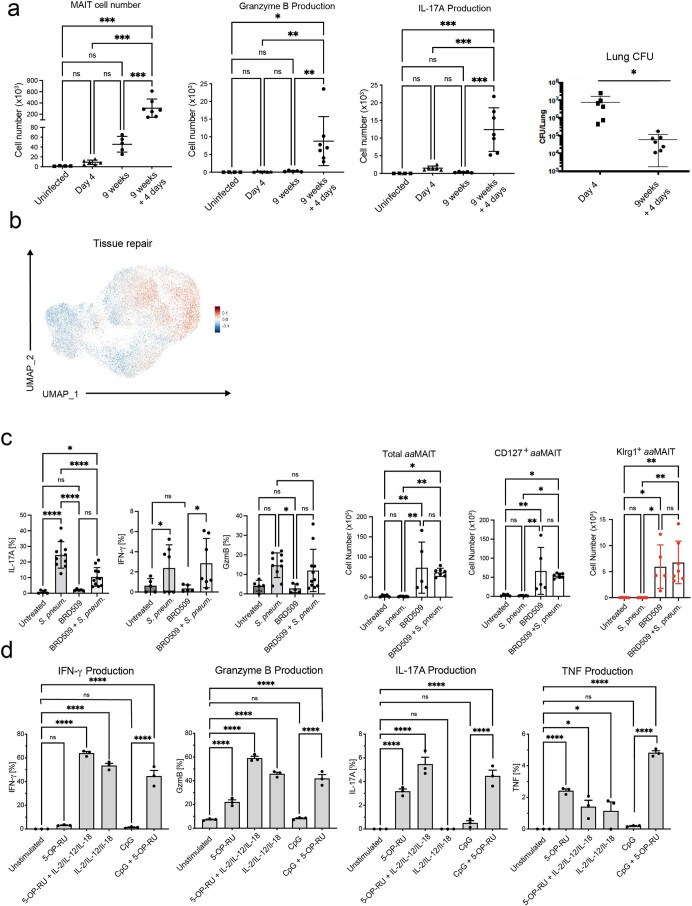
Extended Data Fig. 6. Re-activated aaMAIT cells provide protective responses.
a) Number of total MAIT cells, granzyme B+ and IL-17A+ MAIT cells at baseline and at indicated times after BRD509 vaccination or 4 days after re-infection. CFU per lung is shown on the right. Data displayed as mean ± S.D., n = 4, 6, 5, 7 mice per group, one experiment. Statistical significance via one-way ANOVA with Tukey’s multiple comparisons test. ***P = 0.0003 (uninfected vs 9w + 4d), ***P = 0.0001 (4d vs 9w + 4d), ***P = 0.0009 (9w vs 9w + 4d) (Left). *P = 0.0124, **P = 0.0055 (4d vs 9w + 4d), **P = 0.0092 (9w vs 9w + 4d) (GrB). ***P = 0.0002 (uninfected vs 9w + 4d), ***P = 0.0002 (4d vs 9w + 4d), ***P = 0.0001 (9w vs 9w + 4d) (IL-17A). *P = 0.0456 (right) b) Feature plot UMAP representation of a module score for “Tissue repair” derived from the TiRe database c) Cytokine production by MAIT cell subsets in untreated and BRD509 vaccinated mice following infection with S. pneumoniae URF918, 16 hrs post infection. % of pulmonary MAIT cells positive for IL-17A, IFN-γ and Granzyme B are shown for each group (left). Abundance of indicated populations of MAIT cells quantified as absolute count (right). Data displayed as mean ± S.D. n = 5, 10, 5, 11 mice per group, respectively combined from 3 independent experiments (IL-17A, GzmB). n = 5, 7, 5, 7 mice per group, respectively, combined from 2 independent experiments (IFN-γ). Statistical significance assessed via one-way ANOVA with Tukey’s multiple comparisons test, ****P < 0.0001, *P = 0.0328 (IL-17A); *P = 0.0414 (GrB). Cell counts: n = 5, 7, 5, 7 mice per group, respectively, combined from 2 independent experiments. Statistical significance assessed via one-way ANOVA with Tukey’s multiple comparisons test. Total aaMAIT: **P = 0.0054(Untreated vs BRD509), *P = 0.0126(Untreated vs BRD509 + S.pneum.), **P = 0.0022(S.pneum. vs BRD509), **P = 0.0047 (BRD509 vs BRD509 + S.pneum.). CD127+ aaMAIT: **P = 0.0087(Untreated vs BRD509), *P = 0.0249 (Untreated vs BRD509 + S.pneum.), **P = 0.0036(S.pneum. vs BRD509), **P = 0.0101(S.pneum. vs BRD509 + S.pneum.). Klrg1+ aaMAIT: *P = 0.0207(Untreated vs BRD509), **P = 0.0040 (Untreated vs BRD509 + S.pneum.), *P = 0.0115(S.pneum. vs BRD509), **P = 0.0017(S.pneum. vs BRD509 + S.pneum.). d) Cytokine production by pulmonary aaMAIT cells isolated 40 days after vaccination with BRD509, cultured as cell suspensions for 18 hrs with or without re-activation as indicated. Cytokine production determined by intracellular staining and plotted as % of MAIT cells positive for IFN-γ, Granzyme B, IL-17A and TNF. n = 3 mice per group, representing 1 of 2 independent experiments. One-way ANOVA with Tukey’s test for multiple comparisons; IFNγ: ****P < 0.0001, n.sP = 0.8945. GzmB: n.sP = 0.9994, ****P < 0.0001 IL17: n.sP > 0.9, ****P < 0.0001. TNF: ****P < 0.0001. *P = 0.044, *P = 0.034, n.sP > 0.5. Data displayed as mean ± s.e.m. Source numerical data are available in source data.

