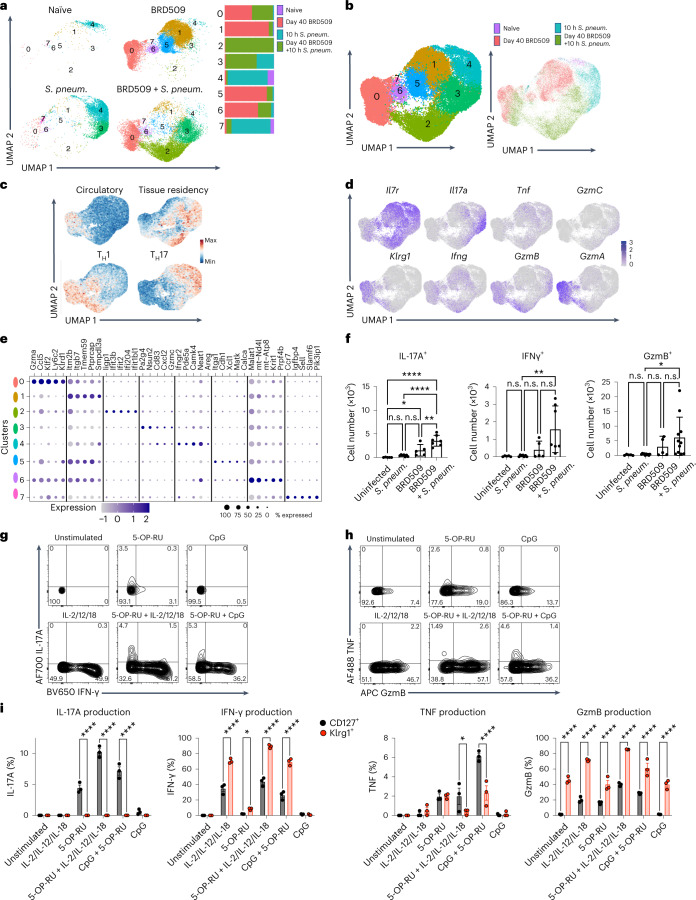
Fig. 3. Effector response by re-activated aaMAIT cells.
a–e, Mice were uninfected (naïve), vaccinated with BRD509 and analysed 40 days later (BRD509), or analysed 10 h after S. pneumoniae infection; infected mice were naïve mice (S. pneum.) or vaccinated 40 days previously (BRD509 + S. pneum.). Pulmonary MAIT cells were pooled from ten mice per group and were sorted and analysed by scRNA-seq. UMAP representation of MAIT cell cluster composition separated by infection regimens as indicated (a) and combined UMAP representations (b). Data from uninfected and BRD509 infected mice are the same sequences as those in Fig. 1c. c, UMAP representation of tissue residency, circulatory, Th1 and Th17 gene signatures d, Feature plots of the indicated genes. e, Top five differentially expressed genes of each cluster represented as dot plots, where circle size represents percentage of cells expressing each gene and colour scale depicts relative expression value. f, Cytokine production by MAIT cell subsets in untreated and BRD509-vaccinated mice 16 h following infection with S. pneumoniae or without infection. Number of pulmonary MAIT cells positive for IL-17A, IFN-γ and Granzyme B are shown for each group. Data displayed as mean ± s.d. n = 5, 7, 5 and 7 mice per group, respectively, combined from two independent experiments (left, middle). n = 5, 10, 5 and 11, mice per group, combined from three independent experiments (right). Statistical significance assessed via one-way ANOVA, with Tukey’s multiple comparisons test; ****P < 0.0001, *P = 0.0487, **P = 0.0029 (left); **P < 0.0068 (middle); *P = 0.0283 (right). g–i, Cytokine and Granzyme production by pulmonary MAIT cells isolated 40 days after vaccination with BRD509, cultured as pulmonary cell suspensions with or without re-activation as indicated. Protein production determined by intracellular flow cytometry. Representative histograms of total MAIT cell IL-17A and IFN-γ (g) or TNF and Granzyme B (h) and quantification (i) of each cytokine produced by either CD127+ MAIT cells (black) or Klrg1+ MAIT cells (red). n = 3 mice per group, representing one of two independent experiments. Two-way ANOVA corrected for multiple comparisons, left: ****P < 0.0001; centre left: *P = 0.0305, ****P < 0.0001; centre right: *P = 0.0283, **** < 0.0001; right: ****P < 0.0001. Data displayed as mean ± s.e.m. Source numerical data are available in source data. n.s., not significant.

