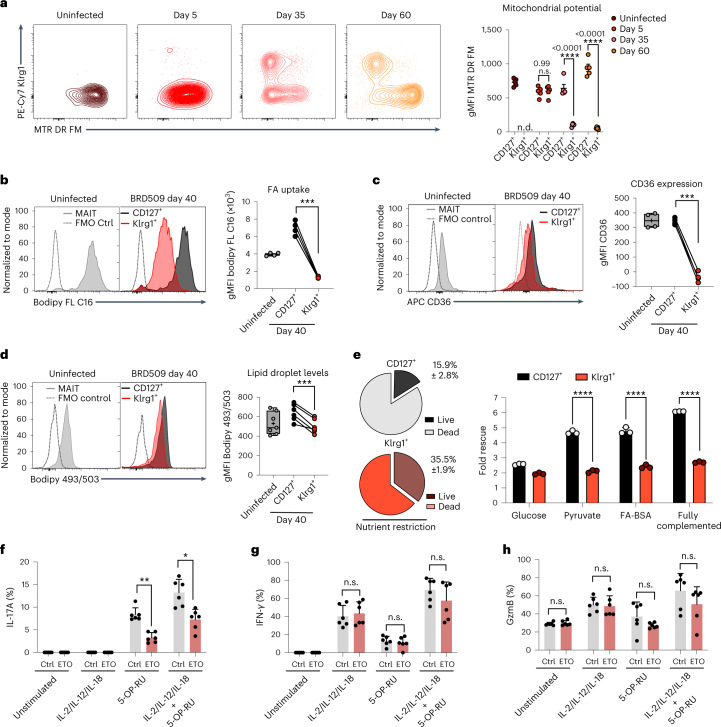
Fig. 4. CD127+aaMAIT cells depend on FA uptake and oxidation.
a–d, Mouse lung aaMAIT cell subsets were analysed at steady state or at the indicated times post BRD509 vaccination. Representative histograms (left) and quantification (right) are plotted as geometric mean fluorescence intensity (gMFI). Mitochondrial membrane potential (a) quantified by MTR DR FM intensity at the indicated times post vaccination. n.d., Klrg1+ MAIT cells not detected. Two-way ANOVA, n = 5 mice per group from one of two independent experiments. Bodipy-FL C16 uptake of fluorescently labelled FA (b). Paired two-tailed t-test, ***P = 0.00014; n = 4 mice per group, n = 2 independent experiments. Surface expression of the scavenger receptor CD36 (c). Paired two-tailed t-test, ***P = 0.0006, n = 4 mice per group, n = 2 independent experiments. Neutral lipid droplet content quantified by Bodipy 493/503 fluorescence (d). Paired two-tailed t-test, ***P = 0.00075. n = 7 and 6 mice per group, n = 2 independent experiments. e, Left: lung MAIT cells at 40 days post BRD509 vaccination were subjected to nutrient restriction for 48 h, and percentage survival was measured via flow cytometry by viability dye positivity. Right: fold rescue of the percentage survival afforded by the indicated nutrient supplementations for CD127+ (black) or Klrg1+ (red) aaMAIT cells (right), ****P < 0.0001. n = 3 mice per group from one of two experiments. f–h, Pulmonary aaMAIT cells were isolated 40 days after vaccination with BRD509, cultured as cell suspensions for 18 h, with or without re-activation as indicated, and assessed for cytokine/granzyme production. FA oxidation/OXPHOS inhibition by Etomoxir (ETO, 90 μM). Two-tailed unpaired t-tests with false discovery rate testing: IL17A **P = 0.0050, *P = 0.02863; IFNγ: n.s.P = 0.659194, n.s.P = 0.581563, n.s.P = 0.258063; GzmB: n.s.P = 0.534601, n.s.P = 0.828580, n.s.P = 0.166802, n.s.P = 0.206856. n = 6 mice per group from one experiment. All data displayed as mean ± s.e.m. Source numerical data are available in source data. n.s., not significant.

