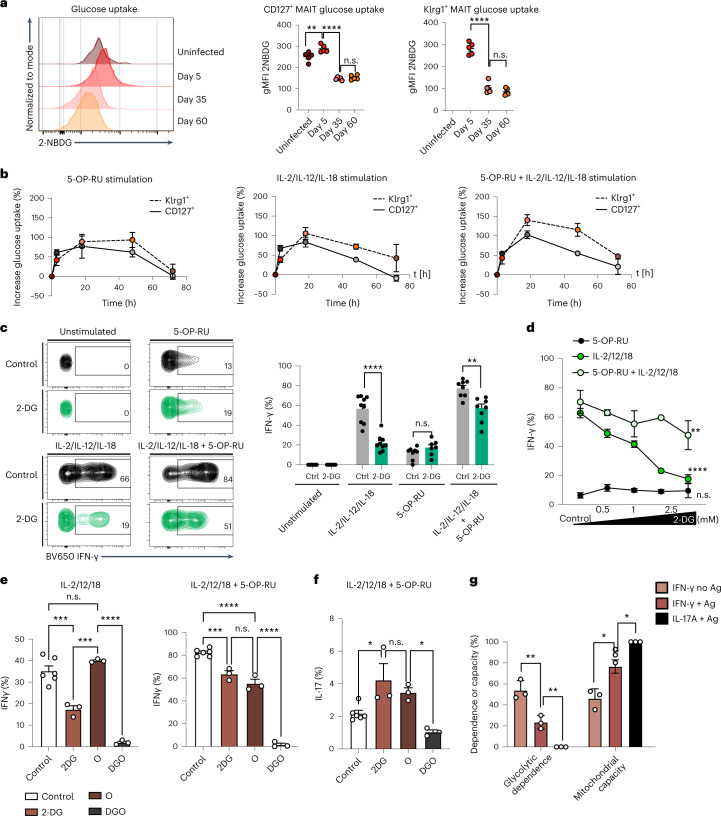
Fig. 5. Klrg1+aaMAIT cells depend on glucose consumption.
a, Pulmonary MAIT cells were assessed for uptake of fluorescent glucose 2-NBDG at the indicated timepoints post BRD509 vaccination. Representative histograms (left) and quantification (right). **P = 0.002736, ****P < 0.0001. n = 5 mice per group from one of two independent experiments. b–d, Pulmonary MAIT cell subsets were isolated from mice 40 days post BRD509 vaccination and analysed for metabolic and functional parameters during culture for 18 h with or without re-activation with 5-OP-RU and/or IL-2, IL-12 and IL-18, as indicated. Kinetics of fluorescent glucose 2-NBDG uptake (added for last 30 min) at indicated durations of re-activation in minutes and quantified as percentage increase over baseline (b). n = 6 mice per group, n = 2 experiments. Representative histograms (left) and quantification (right) (c) of IFN-γ production following 18 h re-activation. Glycolysis was inhibited by 2-deoxy-glucose (2-DG, green colour). ****P < 0.0001, n.s.P = 0.142985, **P = 0.001908; multiple two-tailed unpaired t-tests. n = 9, 9, 8 and 8 independent samples over n = 2 experiments. Dose and activation mode (TCR and/or cytokines) dependence of the concentration of 2-DG on IFN-γ production at 18 h re-activation (d). **P = 0.0085, ****P < 0.0001; ANOVA with Dunnett’s post-test for multiple comparisons. n = 3 independent samples per group from one experiment. e–g, Metabolic inhibition of effector functions was assessed in pulmonary aaMAIT cells isolated from mice 40 days post BRD509 vaccination. Dependence and capacity were calculated according to Extended Data Fig. 8d. Oligomycin A (O); 2-DG plus Oligomycin A (DGO). Ordinary one-way ANOVAs with Tukey’s multiple comparisons testing. Left: ***P = 0.0004, ***P = 0.0002, ****P < 0.0001; right: ***P = 0.0003, ****P < 0.0001, n.s.P = 0.1411 (e); *P = 0.0247, n.s.P = 0.6949, *P = 0.0210 (f); **P = 0.009319, **P = 0.003056, *P = 0.029, *P = 0.0106 (g). n = 6, 3, 3 and 3 from one of two experiments (e and f) or n = 3 from one of two experiments (g). All data displayed as mean ± s.e.m. Source numerical data are available in source data. n.s., not significant.

