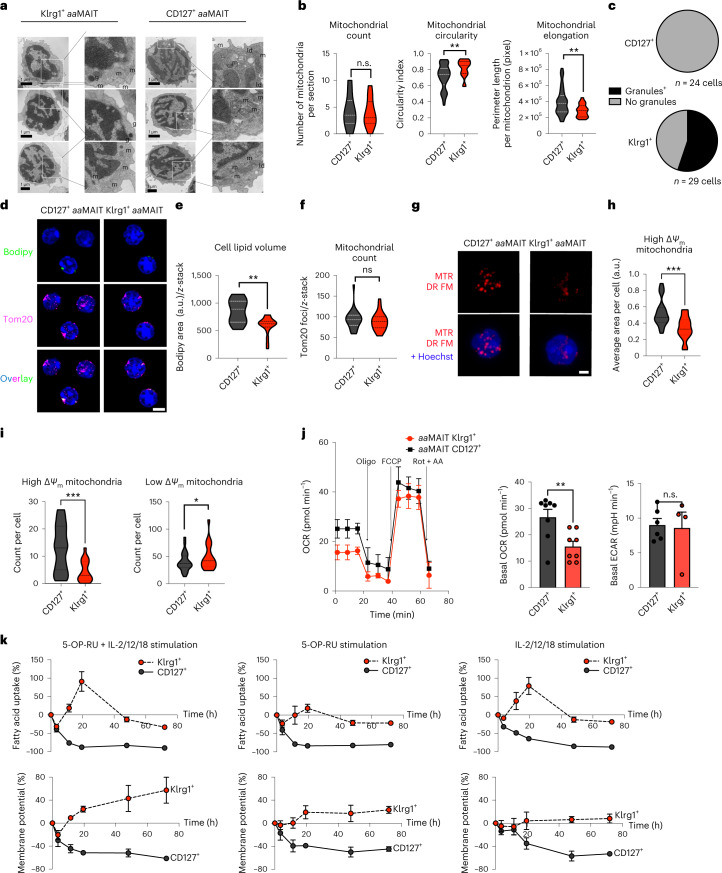
Fig. 6. Klrg1+aaMAIT cells have abundant but dormant mitochondria that are rapidly responsive to activation.
Sorted mouse pulmonary aaMAIT cell subsets were analysed for mitochondrial content and function at >40 days post BRD509 vaccination. a, Representative images. m, mitochondria; ld, lipid droplet; g, granule. Scale bar, 1 μm. b,c, Quantification of mitochondrial number and morphology (b) and cytotoxic granule count (c) from transmission electron micrograph sections of aaMAIT cell subsets. n.s.P = 0.504661. **P = 0.003697, **P = 0.003851; unpaired two-tailed t-tests. In b, n = 22, 22, 21, 54, 22 and 54 cells from five pooled mice per each group. In c, n = 24 and 29 cells per group. d–f, Representative images (d) and quantification (e and f) of Bodipy493/503-positive lipid droplets (green) and mitochondrial Tom20 protein (purple) from z-stack composite airy-scan confocal micrographs of sorted aaMAIT cell subsets. Hoechst 33342 demarcates nucleus (blue). Scale bar, 5 μm; **P = 0.00130, n.s.P = 0.9; Mann–Whitney, two-tailed. n = 25, 20, 25 and 20 cells per group, pooled from five mice per group over two independent experiments. g–i, Representative images (g) and quantification (h and i) of mitochondrial ΔΨm by MTR DR FM intensity. Hoechst 33342 demarcates nucleus (blue, in bottom row combined channel images). Scale bar, 5 μm. Quantification represents the area (h) and count (i) of mitochondria that have high or low ΔΨm signal, respectively. n = 27 and 20 cells per group, pooled from five mice per group over two independent experiments. ***P = 0.0005 (h), ***P = 0.0004, *P = 0.047 (i); all Mann–Whitney, two-tailed. j, OCR kinetics (left) in response to injection of Oligomycin (Oligo), FCCP, Rotenone (Rot) and Antimycin A (AA) measured by Seahorse Bioanalyzer in sorted subsets of pulmonary aaMAIT cell subsets 40 days after vaccination with BRD509. OCR (middle) and basal ECAR (right) were measured without drug treatments or stimulation. **P = 0.0072, n.s.P = 0.84; unpaired, two-tailed t-tests. n = 8, 7, 6 and 4 independent samples per group, pooled from ten mice per group from one of two experiments. k, Quantification of mitochondrial ΔΨm by MTR DR FM and uptake of Bodipy-FL C16 FA in MAIT cell subsets isolated from lungs 40 days post vaccination with BRD509 and cultured as pulmonary cell suspensions for 18 h with or without re-activation with antigen (5-OP-RU), cytokines (IL-2/-12/-18) or the combination. n = 6, 3 and 3 independent samples per group from one experiment. All data displayed as mean ± s.e.m. Source numerical data are available in source data. n.s., not significant.

