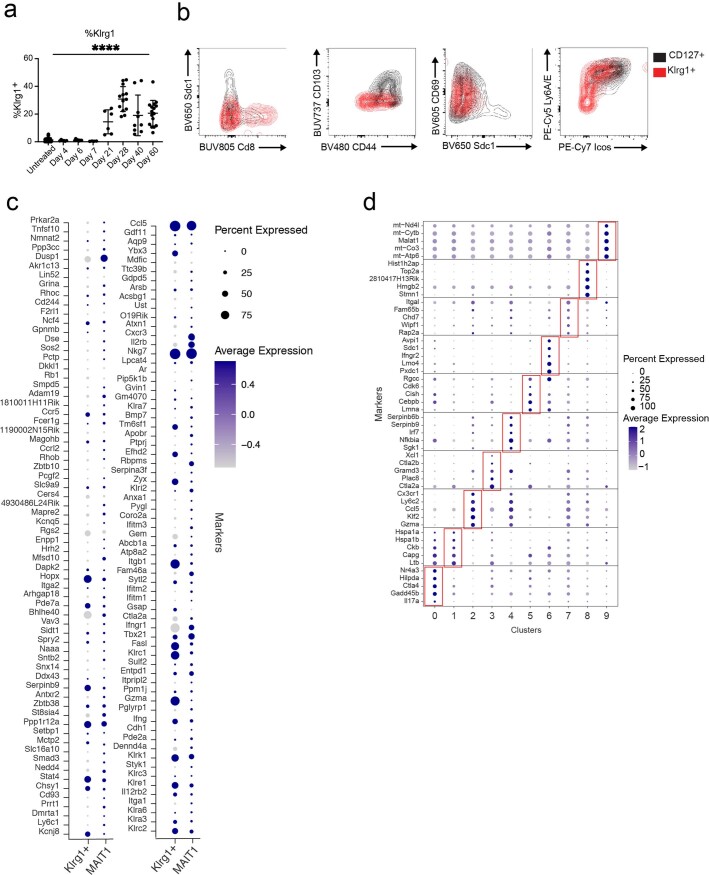
Extended Data Fig. 2. mRNA and protein marker phenotypes of aaMAIT cell subsets.
a) % of Klrg1+ MAIT cells at indicated timepoints. n = 28, 6, 8, 4, 6, 13, 9, 16, mice per group, respectively, combined from 9 independent experiments. One-way ANOVA, ****P < 0.0001. b) Protein expression of the indicated proteins measured by flow cytometry in subsets of day 40 aaMAIT cells. c) aaMAIT cell clusters 2 and 4 with a Th1 gene expression were compared with steady state MAIT1 cells from publicly available data for expression of MAIT1 signature genes15,19. d) Top 5 differentially expressed genes of each cluster represented as dot plots, where circle size represents % of cells expressing each gene and color scale depicts relative expression value. Source numerical data are available in source data.

