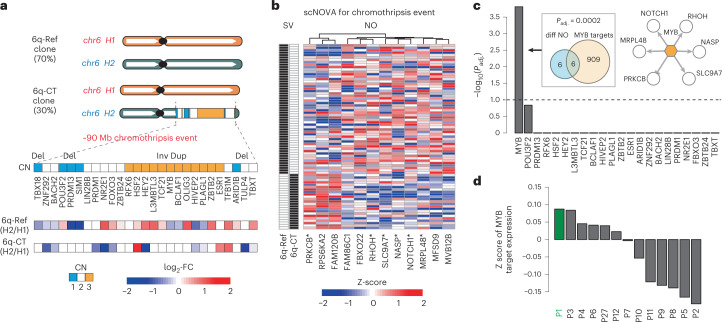
Fig. 5. scNOVA identifies functional effects of a subclonal chromothripsis event.
a, The 27 TF genes located in a segment that underwent chromothripsis24 on 6q in T-ALL_P1. Haplotype-specific NO measurements, which scNOVA generated for CREs assigned to the nearest genes, are depicted below. FC of normalized haplotype-specific NO is shown for each subclone. 6q-CT, subclone bearing chromothripsis on 6q; 6q-Ref, subclone bearing a not rearranged chromosome 6. b, Heatmap of 12 genes with differential activity between subclones in T-ALL_P1, based on scNOVA (denoted CT gene signature). Asterisks denote TF targets highlighted in c. c, TF target over-representation analyses for CT gene signature, revealing c-Myb as the only significant hit. Venn diagram depicting enrichment of c-Myb targets (P value based on an FDR-adjusted hypergeometric test). Upper right, network with c-Myb and its target genes based on scNOVA, combined with previous knowledge. d, Mean Z scores of c-Myb target gene expression measured by bulk RNA-seq in a panel of 13 T-ALL-derived samples. T-ALL_P1 (P1) exhibited the overall highest expression of c-Myb targets.

