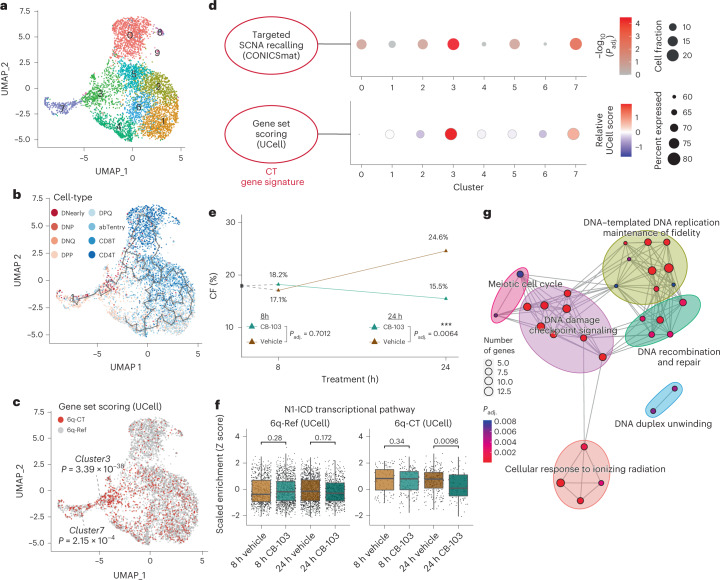
Fig. 6. Targeting the chromothriptic subclone in cell culture.
a, Uniform manifold approximation and projection (UMAP) of scRNA-seq data showing ten unsupervised clusters in T-ALL_P1. b, Overlay of gene set-derived cell-type annotation and inferred lineage trajectory onto this UMAP. c, Single cells whose expression profiles matched the CT gene signature (gene set UCell score > (median score + s.d.)) are assigned to ‘6q-CT’ and shown in red; the remaining cells did not meet the threshold for the CT gene signature (assigned ‘6q-Ref’ status’). P values depict enrichment of 6q-CT cells in clusters 3 and 7. d, Significant enrichment of 6q-CT cells in clusters 3 and 7 based on scRNA-seq. Upper panel, dot plot showing the significance of over-representation of 6q-CT calls in scRNA clusters based on targeted SCNA recalling (P values based on FDR-adjusted Fisher’s exact tests). Lower panel, gene set-level expression summary for the CT gene signature, derived using UCell81 with the directionality of expression changes taken into account. e, CF of 6q-CT cells after treatment with Notch inhibitor CB-103 (green) and vehicle control (brown) along a time course 8 h before and 24 h after treatment. CF was estimated by transferring gene set based CT annotations obtained from the scRNA-seq of T-ALL_P1 before treatment to the scRNA-seq of T-ALL_P1 after treatment. Changed CF (%) at 24 h compared with 8 h is shown in the plot on top of the 24 h datapoints. For each timepoint, the difference of CF under vehicle and CB-103 was evaluated by Fisher’s exact test (results are based on pairwise comparisons). f, Scaled enrichment scores obtained by single-cell gene set enrichment analysis for the ‘N1-ICD transcriptional pathway’ gene set. Scores across treatment conditions (vehicle versus CB-103) were compared using two-sided Wilcoxon rank sum tests. (Boxplot was defined by minima = 25th percentile – 1.5× IQR, maxima = 75th percentile + 1.5× IQR, center = median and bounds of box = 25th and 75th percentile; n = 665, 978, 915 and 556 cells for 6q-Ref from 8 h Vehicle, 8 h CB-103, 24 h Vehicle and 24 h CB-103; n = 91, 157, 213 and 88 cells for 6q-CT for each condition, respectively.) g, Network representation of GOBPs enriched by differentially expressed genes in 6q-CT compared with 6q-Ref cells under CB-103 treatment (24 h), subtracting any genes not specific to the drug treatment.

