Fig. 4.
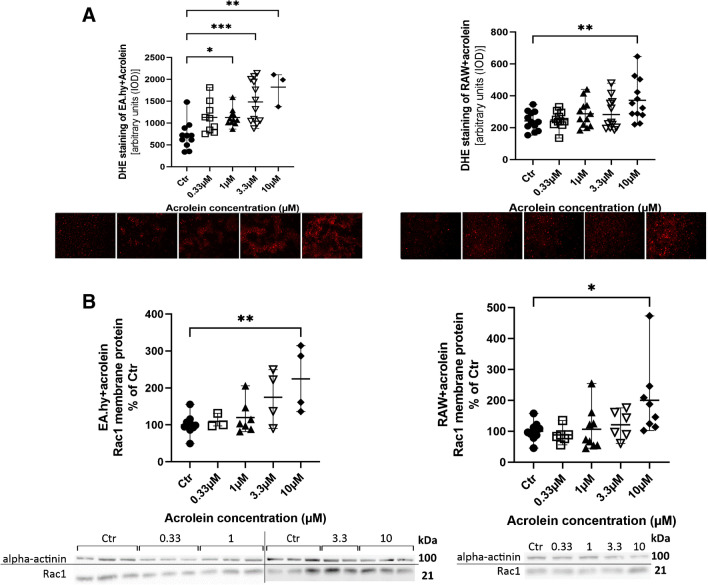
Acrolein effects on intracellular ROS formation and membrane Rac1 protein content in EA.hy and RAW cells. A Cells were stained with dihydroethidium (DHE) and fluorescence of the oxidation products (2-HE and E +) was recorded under a microscope (ex. 510–520 nm/em. 580–610 nm). The fluorescence intensity was quantified and shown as arbitrary units (IOD, mean ± range). Representative images are presented underneath the quantification of DHE staining. B Membrane protein of Rac1 after incubating the EA.hy and RAW cells with acrolein. Original blots are presented underneath the densitometric quantification. Data are presented as percentage of control (mean ± range). Each data point indicates an independent experiment. Non-parametric Kruskal–Wallis test was performed in panel A since the data did not pass normality test, whereas conventional 1-way ANOVA analysis was performed in panel B. Significance is indicated as *, **, *** and **** when p < 0.05, p < 0.01, p < 0.001 and p < 0.0001 respectively

