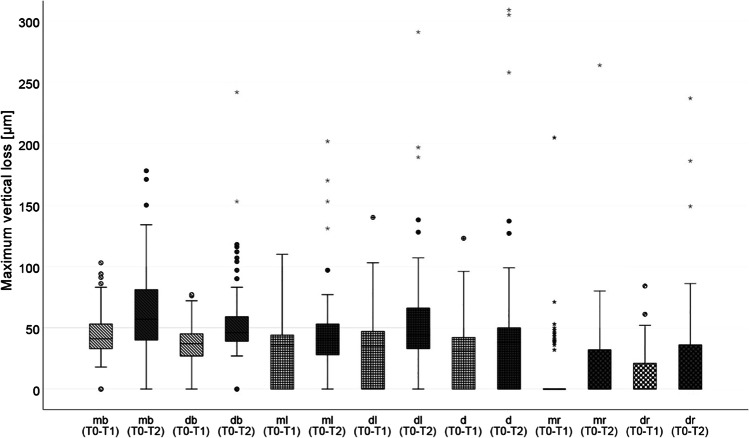
Fig. 4.
Boxplot diagram of the maximum vertical loss values [μm] for n = 81 study teeth after 12-month (T0–T1) and 24-month (T0–T2) observational period distributed to the seven areas (mesiobuccal (mb), distobuccal (db), mesiolingual (ml), distolingual (dl) and if existing distal (d) cusp as well as mesial (mr) and distal ridge (dr)). Buccal cusps are shaded oblique, lingual cusps are checkered small and ridges are checkered large; outliners (Ο), extreme values (*)

