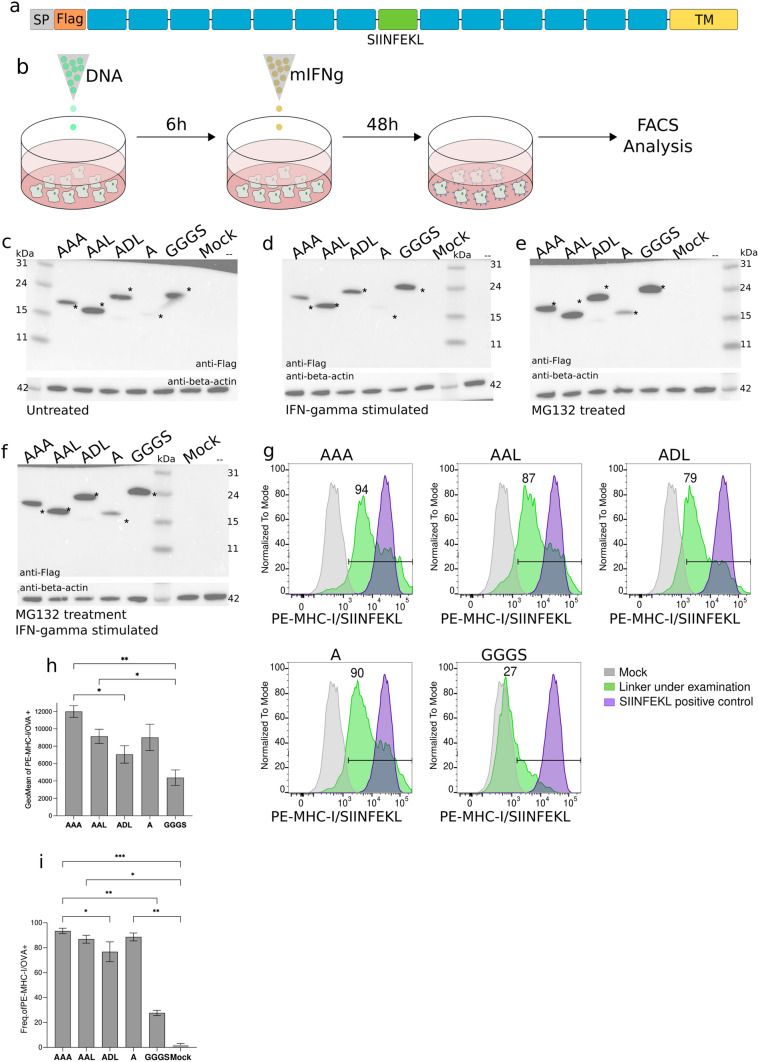
Fig. 2.
Linker sequences module antigen presentation. a Schematic representation of the constructs used. Gray: signal peptide (SP); orange: FLAG tag; blue: neoantigens; green: SIINFEKL peptide; and, yellow: mouse CD44 transmembrane domain. b Graphical scheme of the experimental procedure used for linker screening. c Western blot analysis of the expression of recombinant proteins untreated transfected B16-F10 cells. Asterisk indicates expected molecular weight. d Western blot analysis of the expression of recombinant proteins in IFN-g stimulated transfected B16-F10 cells. Asterisk indicates expected molecular weight. e Western blot analysis of the expression of recombinant proteins in MG132-treated transfected B16-F10 cells. Asterisk indicates expected molecular weight. f Western blot analysis of the expression of recombinant proteins in IFN-g stimulated and MG132-treated transfected B16-F10 cells. Asterisk indicates expected molecular weight. g Representative flow cytometry panels for the detection of MHC-I/SIINFEKL on the surface of transfected B16-F10 cells. Frequency of positive cells for the linker under examination is represented on each panel. Gray: mock; green: linker under examination; purple: SIINFEKL positive control. h Levels of MHC-I/SIINFEKL on the surface of B16-F10 transfected cells expressed as geometric mean plus SD of three independent experiments. i Frequency of MHC-I/SIINFEKL positive cells. Mean plus SD of three independent experiments is shown. Data were analyzed using Dunn’s test, **P < 0.01, *P < 0.1

