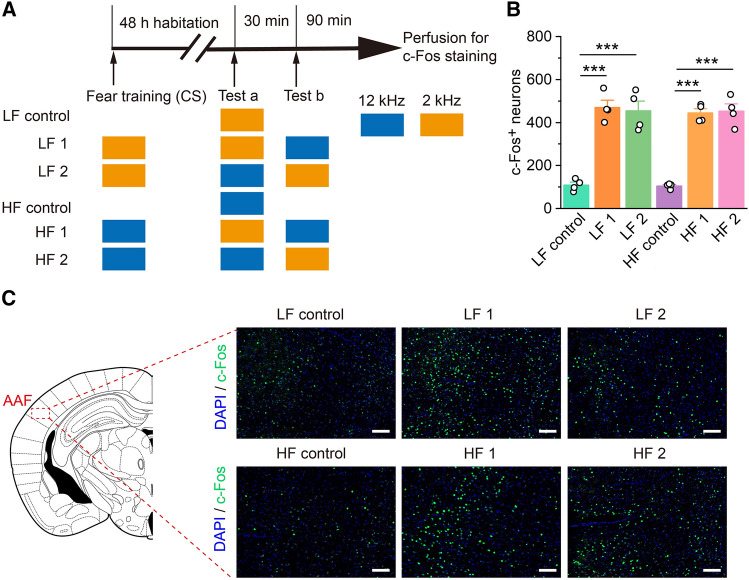
Fig. 2.
c-Fos-positive cell numbers are significantly elevated in the AAF after auditory frequency discrimination. A Experimental timeline for c-Fos immunofluorescence staining. LF (low frequency), HF (high frequency). B c-Fos-positive cell numbers in the AAF are significantly higher after frequency discrimination in the sound training groups (n = 4 per group). C Representative immunofluorescence images for c-Fos immunofluorescence staining (scale bars, 100 μm). All data are shown as the mean ± SEM; ***P <0.001, unpaired Student’s t-test.

