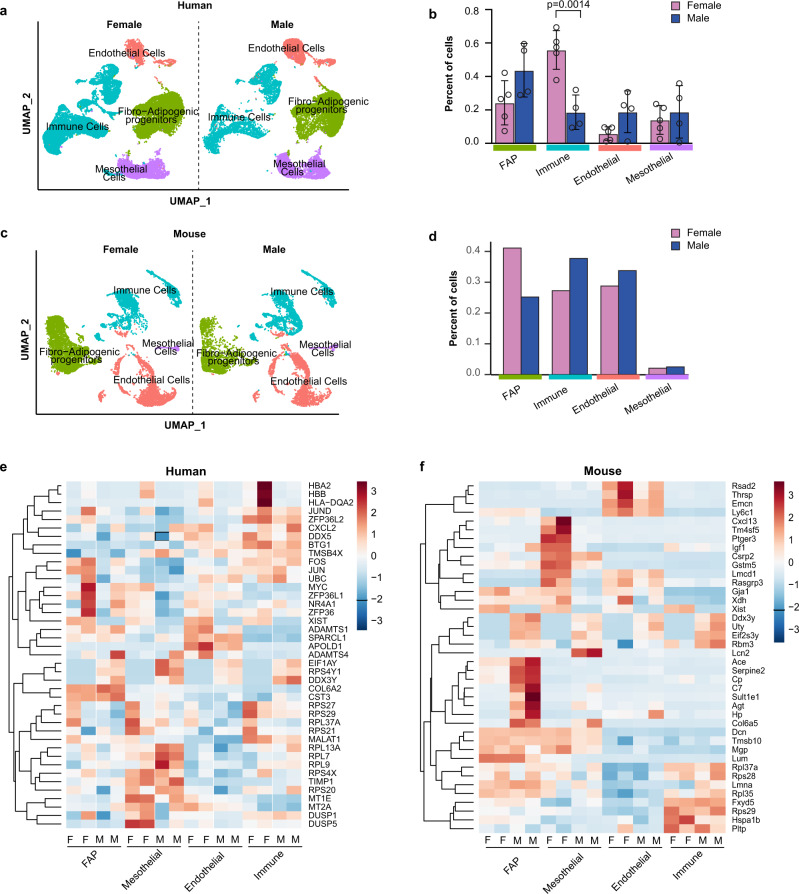
Fig. 2. Effects of sex on visceral adipose tissue (VAT) cellular composition in humans and mice.
a UMAP of major cell types in the SVF of human omental fat samples split by sex. b Proportion of each cell type in female or male human samples. c UMAP of major cell types in the SVF of mouse perigonadal fat samples split by sex. d Proportion of each cell type in female or male mouse samples. e Heatmap of the top 10 upregulated genes in each cell type for the female vs. male contrasts in humans. f Heatmap of the top 10 upregulated genes in each cell type for the female vs. male contrasts in mice. Values are mean ± SD in (b). n = 4 females and 5 males for (b) and n = 1 pooled sample from n = 10 male mice and n = 1 pooled sample from n = 10 female mice for (d). **p < 0.005 versus male within the same cell cluster. An unpaired t Test was used to compare the means for each cell cluster.

