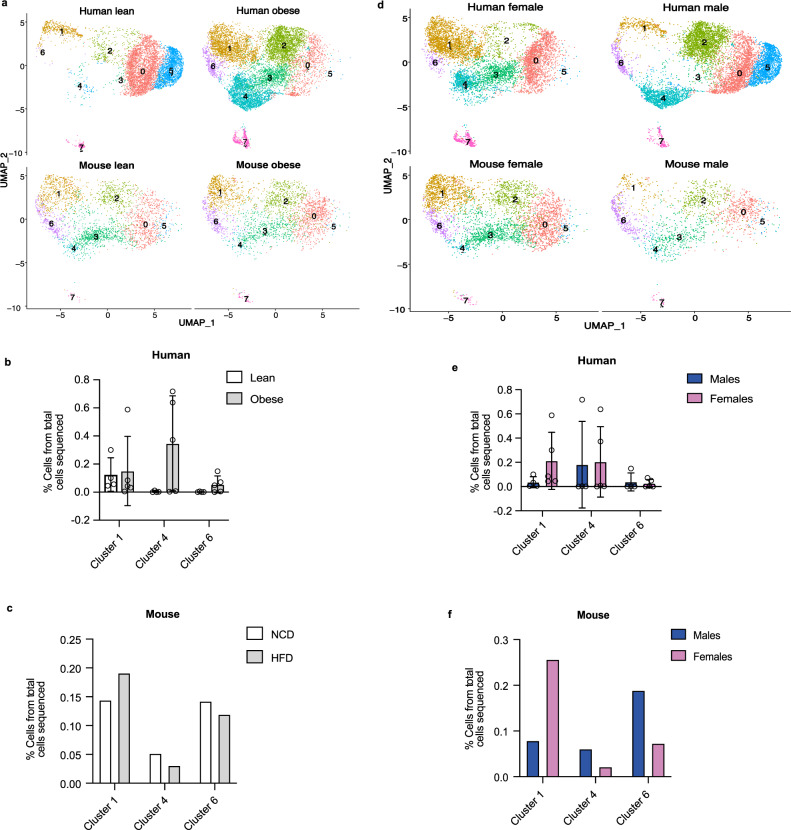
Fig. 3. Effects of obesity and sex on FAP clusters in VAT of humans and mice.
a, d UMAPs of FAP clusters in human and mouse separated by obesity status. b, c The effects of obesity on the proportions of FAP clusters 1, 4, and 6 in humans and mice. e, f The effects of sex on the proportions of FAP clusters 1, 4, and 6 in humans and mice. Values are mean ± SD. n = 4 lean and 5 obese for (b); n = 4 females and 5 males for (e) and n = 1 pooled sample from n = 10 male mice and n = 1 pooled sample from n = 10 female mice fed either a normal chow diet (NCD) or a high-fat diet (HFD) for (c, f).

