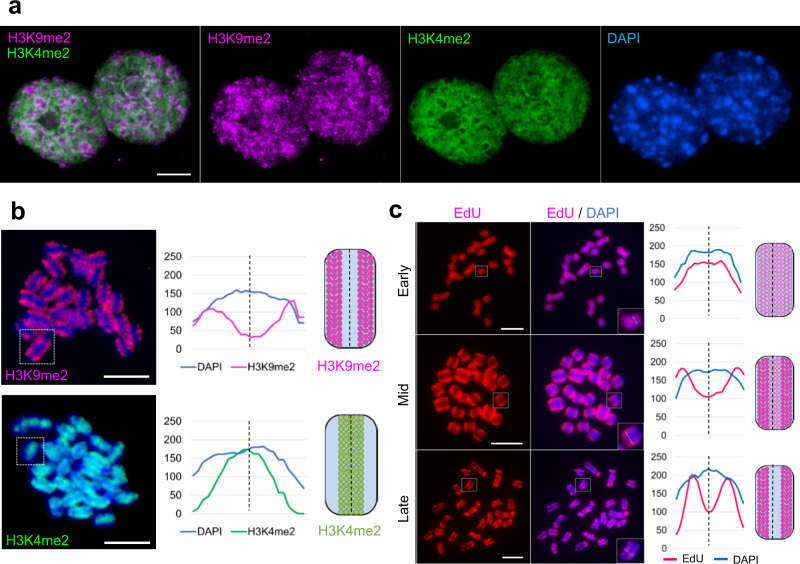
Fig. 6. Visualization of eu- and heterochromatic regions of C. japonica nuclei and chromosomes.
The immunolabeling patterns of histone H3K9me2 (purple) and H3K4me2 (green) in (a) interphase nuclei and (b) in metaphase chromosomes confirm the large-scale eu- and heterochromatin organization. c EdU labeling patterns (purple) show the DNA compartments replication at early, mid, and late S phases. b, c The line scan plot profiles show the signal intensities of histone marks, EdU and DAPI measured in the framed chromosomes (squares). Chromosomes were counterstained with DAPI. Signal distribution along single chromosomes is depicted as schemata next to the profiles. Scale bar, 5 µm. a–c At least two independent experiments were carried out to confirm the reproducibility of the labeling patterns. b, c Source data are provided as a Source Data file.

