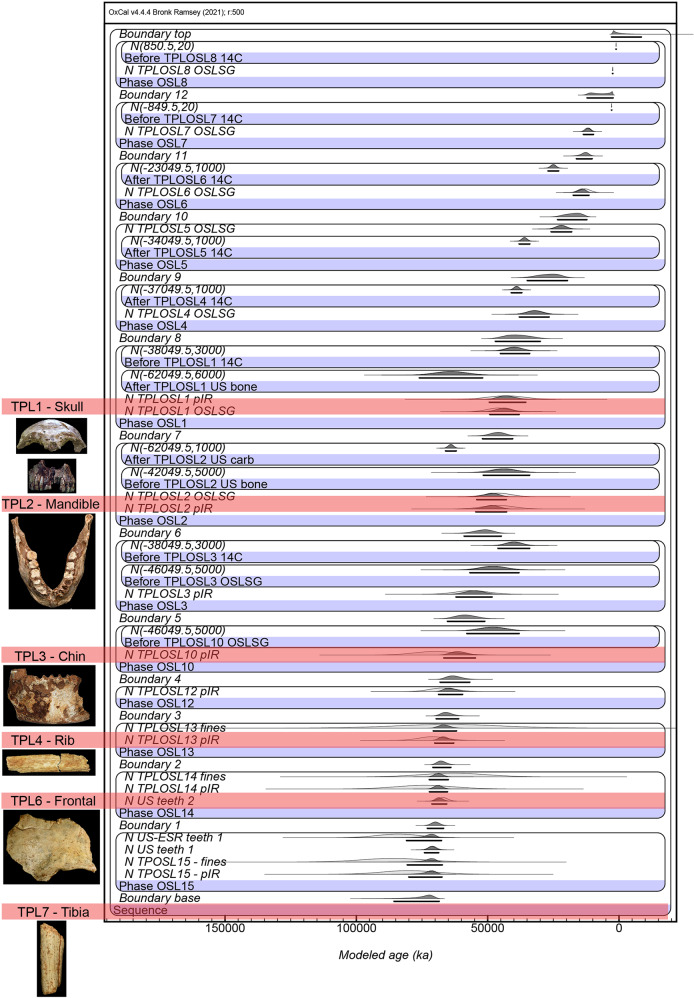
Fig. 5. Modeling of the new TPL chronology.
All 33 radiometric age estimates from TPL (n = 33) have been incorporated into this Bayesian model, which is presented at 2 sigma error margin. The sample names and layers have been entered into the left and correspond with those found on the stratigraphic drawing (Fig. 3). The term “boundaries” represent the borders between each “layer” (defined as a section that contains age estimates, does not correlate with every stratigraphic layer) and the term “phases” represents each layer, the location of each hominin find; US-ESR teeth 1/US teeth 1 are results for TPL-73 and US teeth 2 is result for TPL-74; TPL 1–7 have also been marked for reference.

