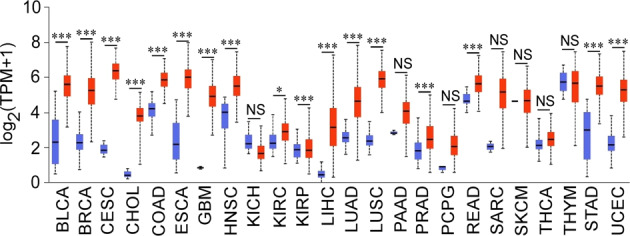
Fig. 1. Expression levels of CDK1 in various cancers.

Comparison of the expression of CDK1 between tumor (red) and normal (blue) tissues. For the boxplots, the center line of the box indicates the median. The upper boundary of the box represents the upper quantile, while the bottom boundary of the box represents the lower quartile. The top and bottom ends of the whiskers indicate the maximum and minimum values, respectively. (*p < 0.05, **p < 0.01, ***p < 0.001, NS: no significant difference).
