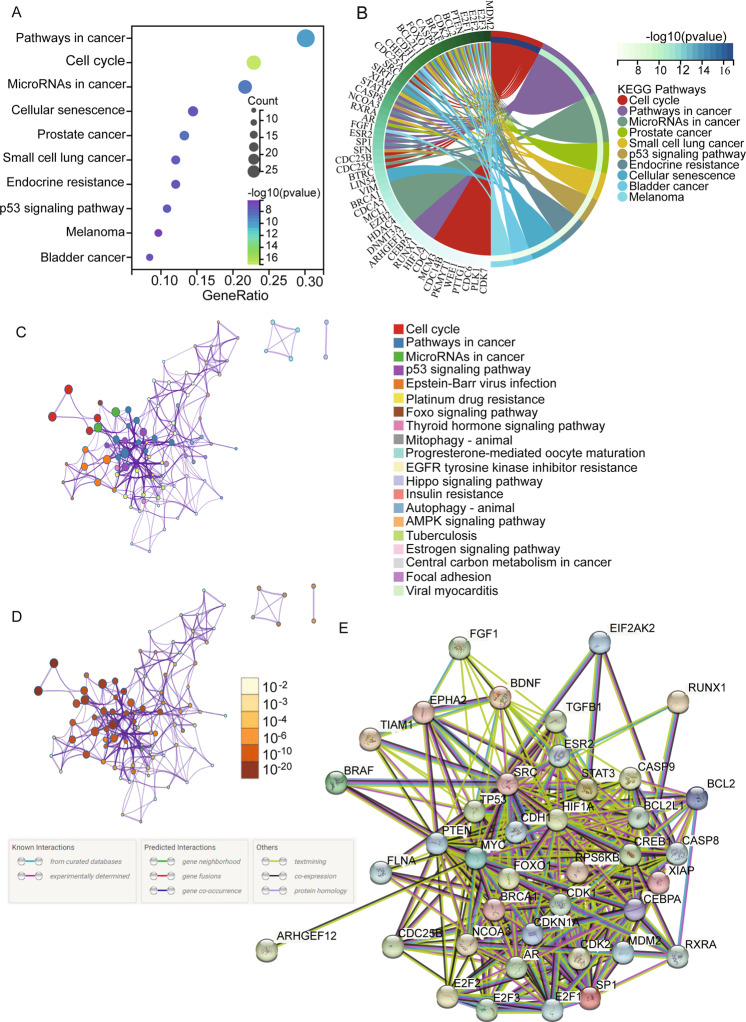
Fig. 3. Signaling pathways associated with CDK interacting proteins.
A Signaling pathways involving CDK1-interacting proteins are identified by KEGG pathway enrichment analyses. Pathways in cancer, cell cycle, and microRNAs and ten top pathways are shown by bubble chart. An FDR of <0.05 was considered statistically significant. B KEGG pathway enrichment analyses cluster plot showing a chord dendrogram of the clustering of the expression spectrum of the proteins involve in ten top pathways. C The network is visualized by using Cytoscape with “force-directed” layout and with edge bundled for clarity. One term from each cluster is selected to have its description shown as the label. D The same enrichment network has its nodes colored by p value, as shown in the legend. The darker the color, the more statistically significant is the node (see legend for p value ranges). E The interacting network of CDK1 and its interacting proteins in Pathways in cancer are demonstrated by using the STRING (https://string-db.org/).

