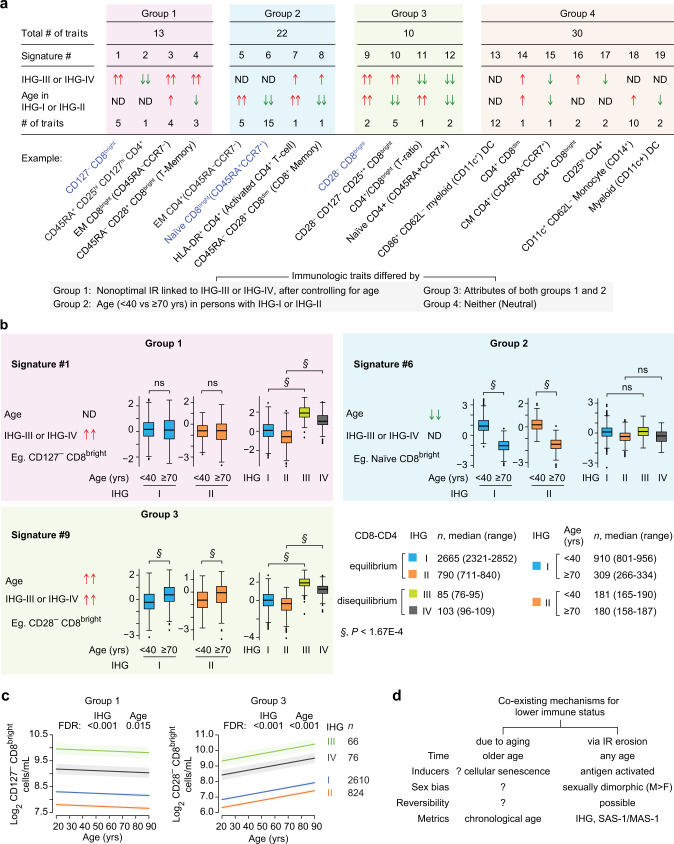
Fig. 10. Immune traits associated with immune health grade (IHG)-III or IHG-IV vs age vs both.
a In the HIV− SardiNIA cohort, 75 immune traits categorized into four groups. Within each group, traits were clustered into signatures according to whether their levels were higher or lower with IHG-III or IHG-IV, after controlling for age and sex; by age in older or younger persons with IHG-I or IHG-II, after controlling for sex; both; or neither. cDC, conventional dendritic cells. Arrows indicate significant difference at P < 1.67E-4; ND indicates no significant difference at P < 1.67E-4. Two arrows indicate both comparisons for IHG-I vs. IHG-III and IHG-II vs. IHG-IV or age within IHG-I and IHG-II are significant, one arrow indicates only one of the comparisons for IHG status or age is significant. b Representative traits by age in persons with IHG-I or IHG-II and by IHG status. Comparisons for the indicated traits were made between IHG-I vs. IHG-III and IHG-II vs. IHG-IV to mitigate the confounding effects of higher and lower CD4+ counts, respectively. Trait levels (y-axis) were normalized using inverse normal transformations with values ranging from −3 to 3; boxplots show covariate-adjusted residuals. Median number of individuals evaluated by IHG status and age within IHG-I or IHG-II. ns nonsignificant. c Linear regression was used to analyze the association between log2 transformed cell counts (outcome) with age and IHG status (predictors). The linear model was used to generate the fitted lines and 95% confidence bands and significance was determined by likelihood ratio test. FDR, false discovery rate P values adjusted for multiple comparisons. d Model differentiating features of processes associated with lower immune status that occur due to aging or via erosion of IR. SAS-1, survival-associated signature-1; MAS-1, mortality-associated signature-1. For box plots: center line, median; box, interquartile range (IQR); whiskers, rest of the data distribution and outliers greater than ±1.5 × IQR are represented as points. Two-sided tests were used. Statistics are outlined in Supplementary Information Section 11.3.10., P values are in Supplementary Data 14, and Source data are provided as a Source Data file.

